Create a bar graph that illustrates the income inequality in Thailand by compari


Create a bar graph that illustrates the income inequality in Thailand by comparing the average income of different occupational groups. Use distinct colors to represent each occupational group. Label the x-axis with occupational groups and the y-axis with average monthly income in Thai baht. Ensure the graph is clear, concise, and visually appealing.
Generation Data
Protokolle
Prompts
Prompts kopieren
Create a bar graph that illustrates the income inequality in Thailand by comparing the average income of different occupational groups
.
Use distinct colors to represent each occupational group
.
Label the x-axis with occupational groups and the y-axis with average monthly income in Thai baht
.
Ensure the graph is clear
,
concise
,
and visually appealing
.
Info
Checkpoint & LoRA

Checkpoint
AutismMix SDXL
#Zeichentrick
#Artikelgestaltung
0 Kommentar(e)
0
0
0
SeaArt schnelle KI-Apps

KI-Video-Erstellung
Entfessle deine Fantasie und lass die KI visuelle Wunder für dich erschaffen.

Gesicht kostenlos tauschen
Erstelle lustige oder realistische Gesichtstausch-Viedeos und Fotos.
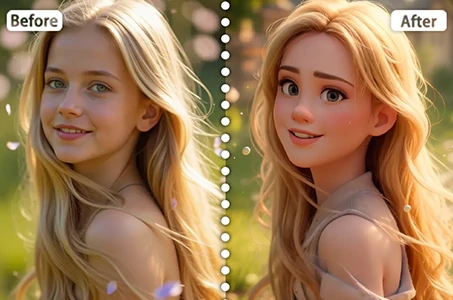
Disney-Filter
Verwandle deine Fotos sofort in Disney-Charaktere.

Geschlechtertausch
Tausche in Fotos und Videos das Geschlecht mit SeaArt KI-Geschlechtswechsler. Genieße unterhaltsame und realistische Transformationen mühelos und kostenlos online!

KI-Entfernung
Entferne ganz einfach unerwünschte Objekte, Wasserzeichen oder Personen aus deinen Fotos.

Hintergrund entfernen
Entferne den Hintergrund von jedem Bild in Sekundenschnelle.
Entdecke mehr KI-Apps