
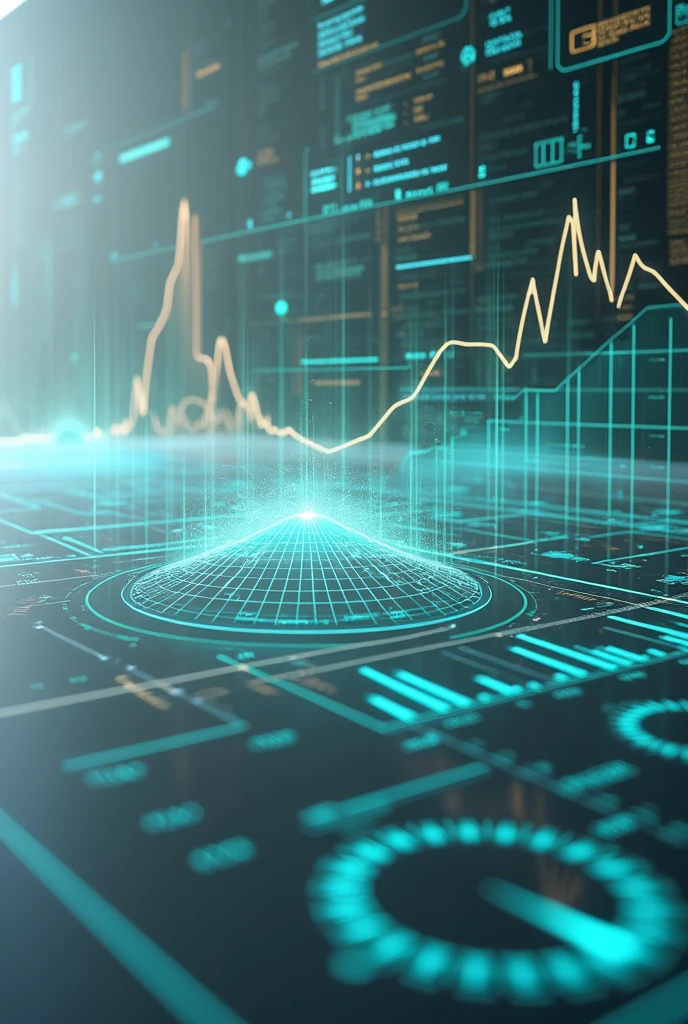
Image Description: Shape and Structure: Graphs and Diagrams


Generation Data
Protokolle
Prompts
Prompts kopieren
Image Description:
Shape and Structure:
Graphs and Diagrams: The image must include graphs and diagrams that represent the measurement and analysis of energies
..
This may include line graphs
,
bars or waves
,
in addition to energy diagrams that symbolize the interpretation of radiesthetic data
.
Energy Standards: Add geometric patterns or waves that represent different frequencies and intensities of energy
.
These patterns can be arranged in layers or overlaps to indicate the complexity of the dowsing
..
Cor e light effects:
Measurement Colors: Use a color palette that includes shades of blue
,
green and gold
,
to represent the accuracy and clarity of energy measurements
.
Colors should be light and contrasting
,
facilitating the visualization of graphs and diagrams
.
light effects: Add soft light effects or glows across the graphs to highlight areas of interest and the intensity of the measured energies
.
Charts may have bright lines or borders to enhance visualization
..
Texture and details:
Digital Texture: The surface of the graphics can have a digital or holographic texture
,
with well-defined lines and shapes that symbolize precision and detailed analysis
.
Add elements of shine and transparency to give a modern and technological look
.
Radiesthetic Symbols: Include symbols related to radiesthesia
,
such as pendulums or dowsing rods
,
integrated into the graphs to represent the tool and methodology used in the measurement
.
Environment and Background:
Neutral or Technological Fund: The background can be a neutral or technological environment
,
like a digital control panel or a clean surface with subtle gradients
.
Background colors may include shades of light gray
,
light blue or white
,
so as not to distract from the main graphics
.
Analysis Effects: Add elements that suggest data analysis and interpretation
,
as numbers
,
scales or captions
,
to emphasize the tool'
;
s function in measuring and analyzing energies
.
Info
Checkpoint & LoRA
Checkpoint
SeaArt Infinity
#Science-Fiction
#SeaArt Infinity
0 Kommentar(e)
0
0
0
SeaArt schnelle KI-Apps

KI-Video-Erstellung
Entfessle deine Fantasie und lass die KI visuelle Wunder für dich erschaffen.

Gesicht kostenlos tauschen
Erstelle lustige oder realistische Gesichtstausch-Viedeos und Fotos.
Bild zu Strichzeichnung
Verwandle mühelos jedes Bild in elegante Strichzeichnungen.
Studio-Ghibli-Filter
Verwandle jedes Foto mit nur einem Klick in einzigartige Ghibli-Style-Kunst.
Cartoon-Avatar-Ersteller
Verwandle deine Fotos sofort in einzigartige Cartoon-Avatare.
Von Anime zur Realität
Erwecke deine Lieblings-Anime-Charaktere sofort zum Leben.
Entdecke mehr KI-Apps