banner_image ×
SeaArt AI Unternehmensversion

Illustrate a three-dimensional graph showing the relationship between the solubi
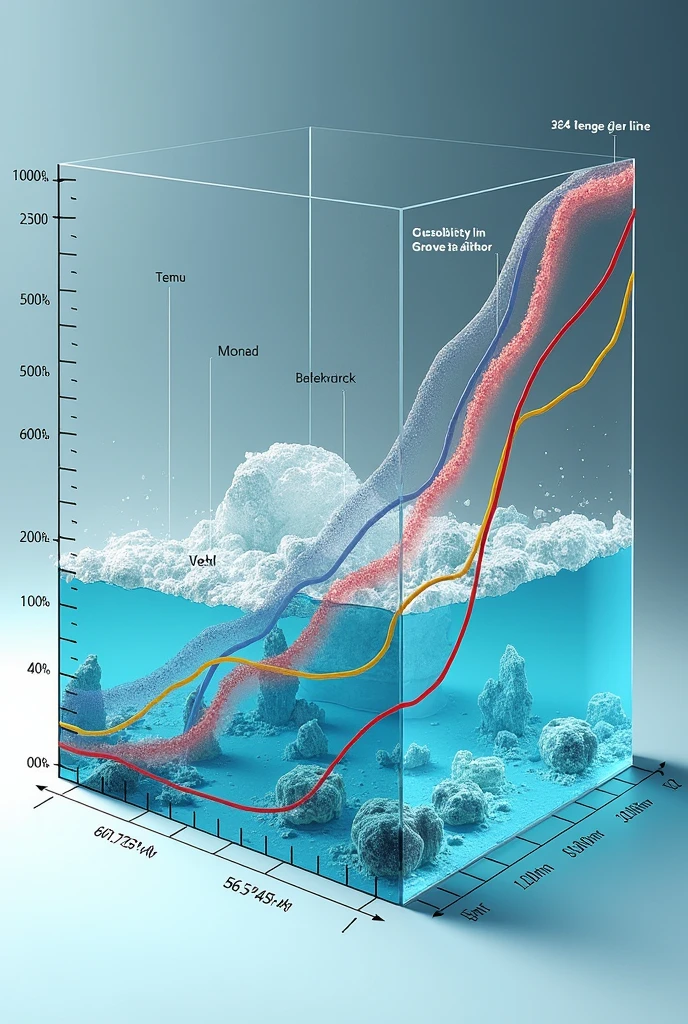
Illustrate a three-dimensional graph showing the relationship between the solubility of a substance (in grams per liter) and the temperature (in degrees Celsius). The horizontal axis represents the temperature, the vertical axis the solubility, and the depth axis can display different substances or types of solvents. Uses an ascending curve to reflect how solubility increases with temperature in most cases. Add different lines or colors for each substance represented, with clear labels to indicate their name and specific characteristics. In the background, includes a visual representation of a crystal dissolving in a liquid to provide visual context about the dissolution process
chatIcon
Ich habe einige gewagte Ratschläge, traust du dich zuzuhören?
KI-Charakter erstellen
image
avatar
S
Seba
Generation Data
Protokolle
Prompts
Prompts kopieren
Illustrate a three-dimensional graph showing the relationship between the solubility of a substance (in grams per liter) and the temperature (in degrees Celsius) . The horizontal axis represents the temperature , the vertical axis the solubility , and the depth axis can display different substances or types of solvents . Uses an ascending curve to reflect how solubility increases with temperature in most cases . Add different lines or colors for each substance represented , with clear labels to indicate their name and specific characteristics . In the background , includes a visual representation of a crystal dissolving in a liquid to provide visual context about the dissolution process
Info
Prompts
Illustrate a three-dimensional graph showing the relationship between the solubility of a substance (in grams per liter) and the temperature (in degrees Celsius). The horizontal axis represents the temperature, the vertical axis the solubility, and the depth axis can display different substances or types of solvents. Uses an ascending curve to reflect how solubility increases with temperature in most cases. Add different lines or colors for each substance represented, with clear labels to indicate their name and specific characteristics. In the background, includes a visual representation of a crystal dissolving in a liquid to provide visual context about the dissolution process
CFG-Scale
6
Schritte
25
Sammler
euler
Seed
1489234755
Scheduler
karras
Bildgröße
688 X 1024
Modell
SeaArt Infinity
Erstellen
Größe
688X1024
Datum
Aug 25, 2024
Modell
Studio
Typ
cell
Checkpoint & LoRA
SeaArt Infinity
Checkpoint
SeaArt Infinity
#Landschaft
#SeaArt Infinity
0 Kommentar(e)
0
0
0

SeaArt schnelle KI-Apps

ai_video_generationimg
KI-Video-Erstellung

Entfessle deine Fantasie und lass die KI visuelle Wunder für dich erschaffen.

face_swap_titleimg
Gesicht kostenlos tauschen

Erstelle lustige oder realistische Gesichtstausch-Viedeos und Fotos.

cartoon_avatar_h1img
Cartoon-Avatar-Ersteller

Verwandle deine Fotos sofort in einzigartige Cartoon-Avatare.

changePersonimg
Ändere die Person auf dem Foto

Ersetze mit KI ganz einfach die Person in jedem Foto.

wanimg2vid_h1img
Wan 2.1 Bild-zu-Video

Animiere Fotos mit realistischer Bewegung und kinematischen Effekten.

video_face_swapimg
Video-Gesichtstausch

Erstelle lustige Videos, indem du Gesichter in jedem Videoclip austauschst.

Entdecke mehr KI-Apps 

Verwandte Inhalte

ControlNet
logo
Deutsch
Anwendungen
Bild erstellen KI-Charaktere Swift AI Modelltraining Canvas Quick Tool Arbeitsablauf
Über sie/ihn
Studio Rangliste KI-Chat KI-Blog KI-Nachrichten
Hilfe
Anleitungen Kundenservice
APP hunterladen
icon
Download on the
APP Store
icon
GET IT ON
Google Play
Uns folgen
iconiconiconiconiconiconiconicon
© 2025 SeaArt, Inc.
Copyright Policy
Nutzungsbedingungen
Datenschutzrichtlinie 特定商取引法 資金決済法に基づく表示
Mehr