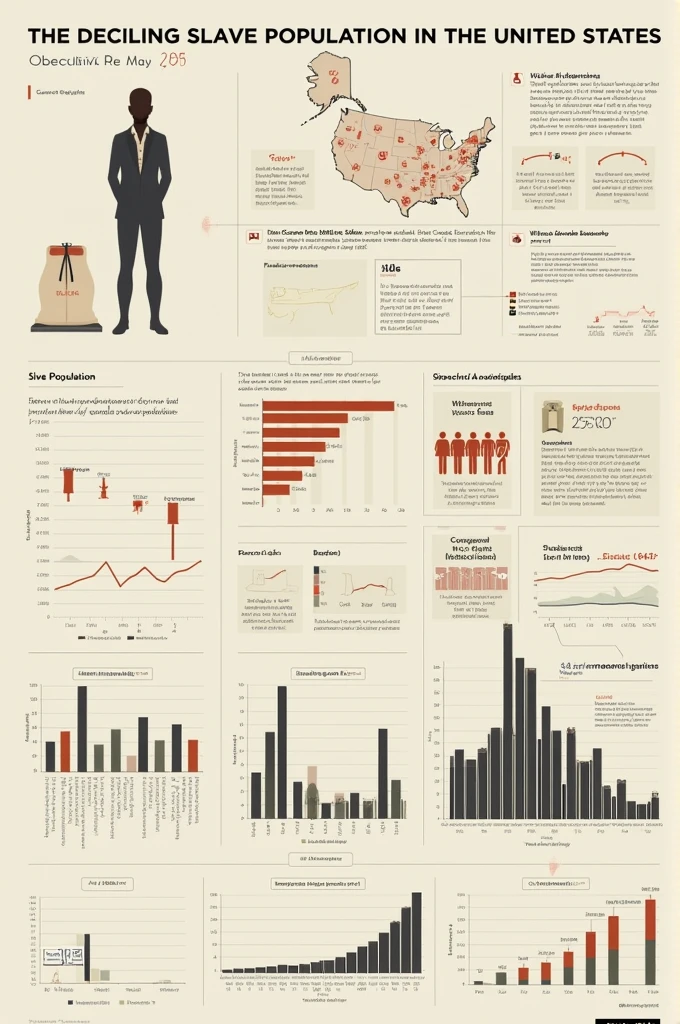
Charts or tables depicting the decline in the slave population between 1825 and

Generation Data
Registro
Prompts
Copiar prompts
Charts or tables depicting the decline in the slave population between 1825 and 1851
.
INFO
Checkpoint & LoRA

Checkpoint
SeaArt Infinity
#SeaArt Infinity
0 comentario(s)
1
0
0


