
Mosaic of graphs and charts: Create a mosaic-style design using Tableau


Generation Data
Records
Prompts
Copy
Mosaic of graphs and charts: Create a mosaic-style design using Tableau's brand colors
,
orange and white
.
Combine various data visualizations such as bar graphs
,
line charts
,
and pie charts to represent the diversity of data analysis
.
INFO
Checkpoint & LoRA
Checkpoint
GrandMix
#Pixel
#Product Design
0 comment
0
0
0
SeaArt Swift AI Apps

AI Video Generation
Unleash your imagination and let AI create visual wonders for you

Face Swap Online Free
Create funny or realistic face swap videos & photos in a snap
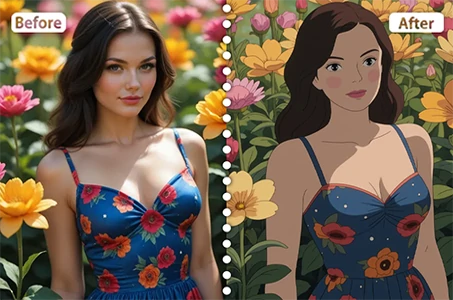
Studio Ghibli Filter
Transform any photo into unique Ghibli-style art in just one click.
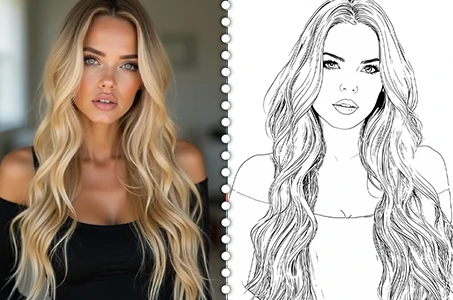
Image to Line Art
Effortlessly convert any image into elegant line art
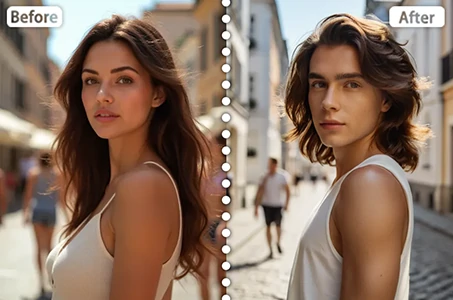
Gender Swap
Swap genders in photos and videos with SeaArt's AI gender swapper. Enjoy fun and realistic transformations effortlessly, free online!

AI Kissing Video Generator
Join the kissing trend with SeaArt's AI kissing video generator instantly. Easily make two people kiss, and create realistic animation.
Explore More AI Apps