
A close up of a graph with a bar chart on it


Prompts
Copy
Make a scatter plot that shows the physical load on the X axis (can be in terms of intensity
,
volume or duration of exercise) and on the Y axis the performance (may be in terms of speed
,
maximum strength
,
endurance
,
etc
.
)
.
Each dot can represent an athlete or a group of athletes
..
INFO
Checkpoint & LoRA
Checkpoint
CyberRealistic
0 comment
0
0
0
SeaArt Swift AI Apps

AI Video Generation
Unleash your imagination and let AI create visual wonders for you

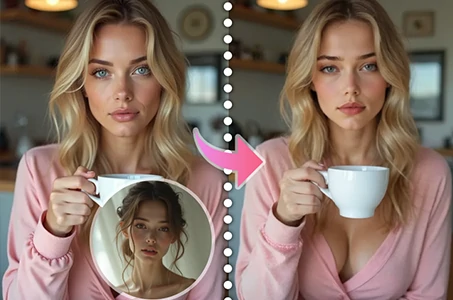
Face Swap Online Free
Create funny or realistic face swap videos & photos in a snap

AI Kissing Video Generator
Join the kissing trend with SeaArt's AI kissing video generator instantly. Easily make two people kiss, and create realistic animation.
Video Face Swap
Create funny videos by swapping faces in any video clip.
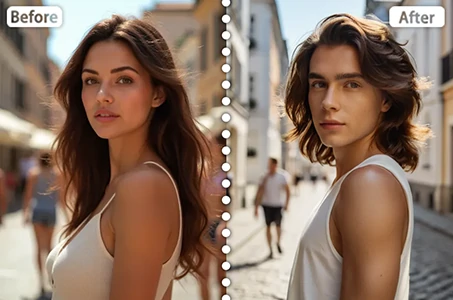
Gender Swap
Swap genders in photos and videos with SeaArt's AI gender swapper. Enjoy fun and realistic transformations effortlessly, free online!

AI Filters
Turns every photo into a work of art
Explore More AI Apps