
1. **Room temperature experiment (Item 1-2)**: - The picture shows two test


Generation Data
Records
Prompts
Copy
1
.
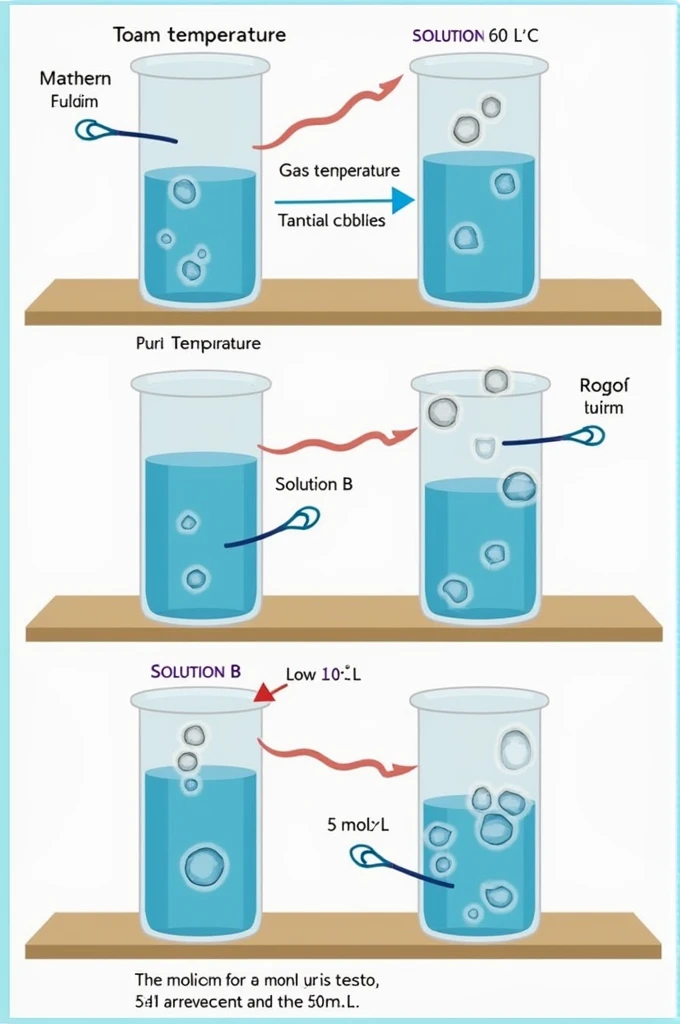
**Room temperature experiment (Item 1-2)**:
- The picture shows two test tubes
,
one containing solution A
.
(0
.
5 mol/L
,
5 ml) and another tube containing solution B (0
.
5 mol/L
,
5 ml)
- Then there is an arrow pointing from tube A to tube B to show that solution A is poured into B
.
- It shows the gas bubbles that occur in test tube B after the two solutions are mixed together
.
2
..
**High temperature experiments (Point 3)**:
- รูปภาพจะคล้ายกับข้อแรก แต่จะแสดงว่าหลอดทดลองทั้งสองหลอดถูกแช่ในภาชนะที่มีน้ำร้อนที่อุณหภูมิ 70 °C เป็นเวลา 2 นาที ก่อนที่จะทำการเทสารละลาย A ลงใน B
- หลังจากนั้นแสดงการเกิดฟองแก๊สในหลอด B ซึ่งอาจจะมากกว่าRoom temperature experiment
3
.
**Low temperature experiments (Item 4)**:
- รูปภาพจะแสดงหลอดทดลองที่ถูกแช่ในภาชนะที่มีน้ำเย็นที่อุณหภูมิ 10 °C แทนน้ำร้อน ก่อนที่จะทำการผสมสารละลาย A กับ B
- หลังจากนั้นแสดงการเกิดฟองแก๊สในหลอด B ซึ่งอาจจะน้อยกว่าRoom temperature experiment
แต่ละรูปภาพจะสื่อถึงการเปลี่ยนแปลงของอุณหภูมิและผลกระทบที่มีต่ออัตราการเกิดฟองแก๊สจากการทดลองนี้
INFO
Checkpoint & LoRA

Checkpoint
SeaArt Infinity
#SeaArt Infinity
0 comment
1
0
0
SeaArt Swift AI Apps

AI Video Generation
Unleash your imagination and let AI create visual wonders for you

Face Swap Online Free
Create funny or realistic face swap videos & photos in a snap
Gender Swap
Swap genders in photos and videos with SeaArt's AI gender swapper. Enjoy fun and realistic transformations effortlessly, free online!
Change the Person in the Photo
Easily replace the person in any photo with AI.
Video Face Swap
Create funny videos by swapping faces in any video clip.
AI Kissing Video Generator
Join the kissing trend with SeaArt's AI kissing video generator instantly. Easily make two people kiss, and create realistic animation.
Explore More AI Apps