Illustrate a three-dimensional graph showing the relationship between the solubi
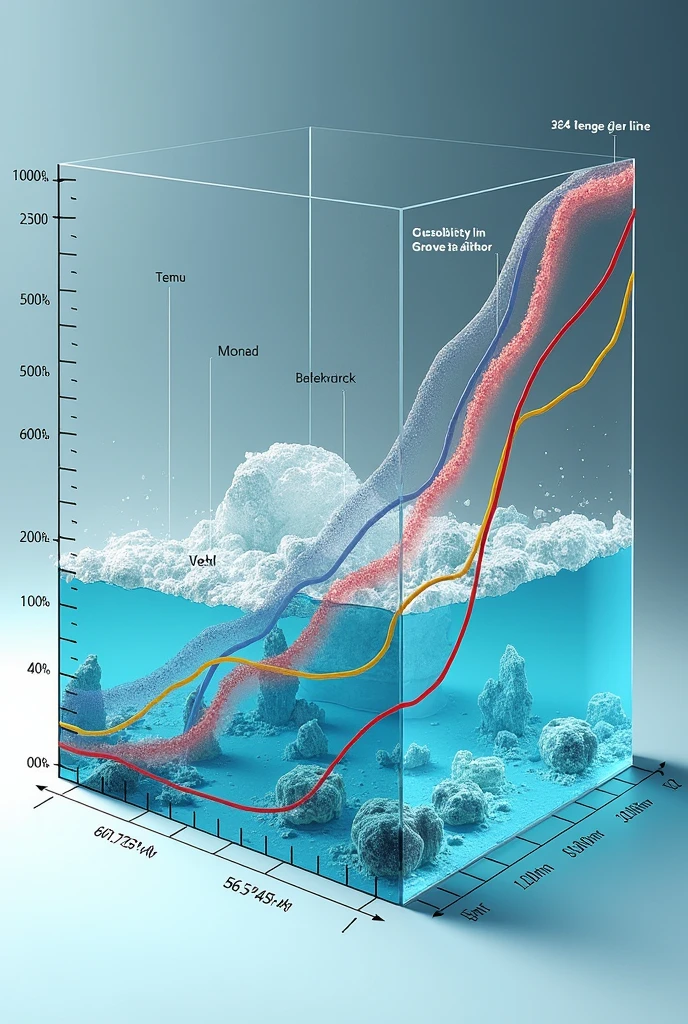


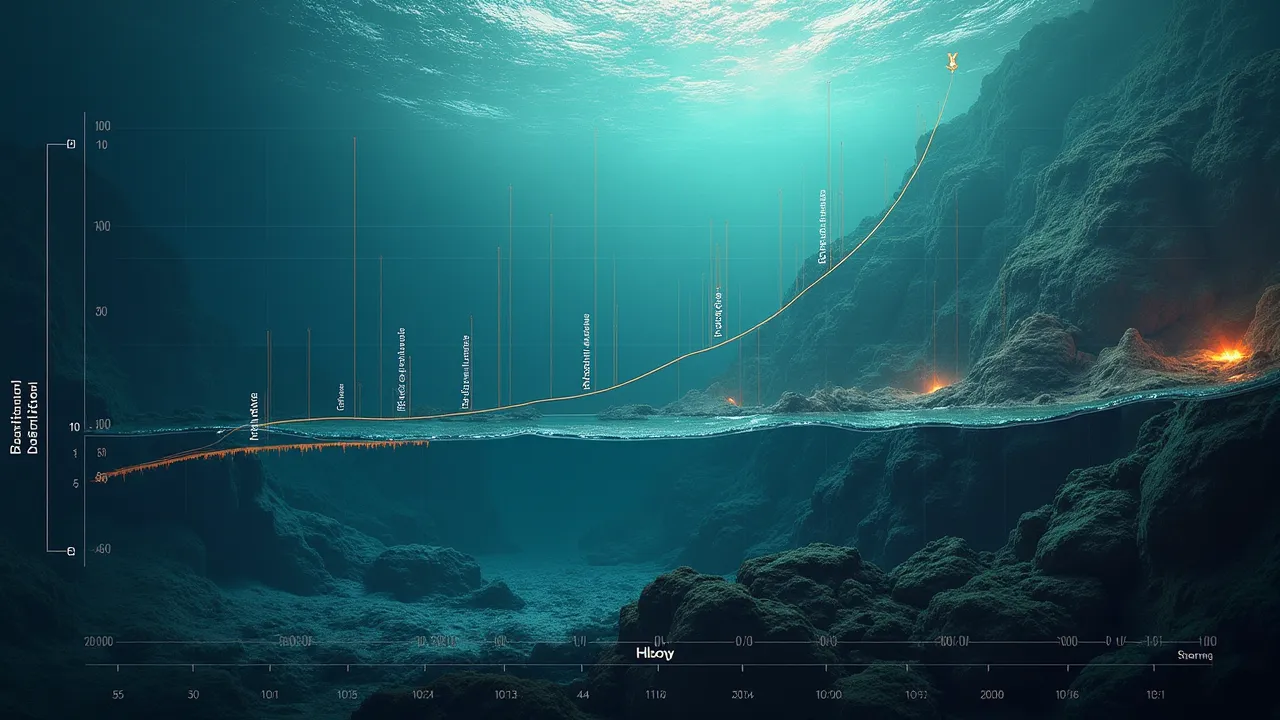
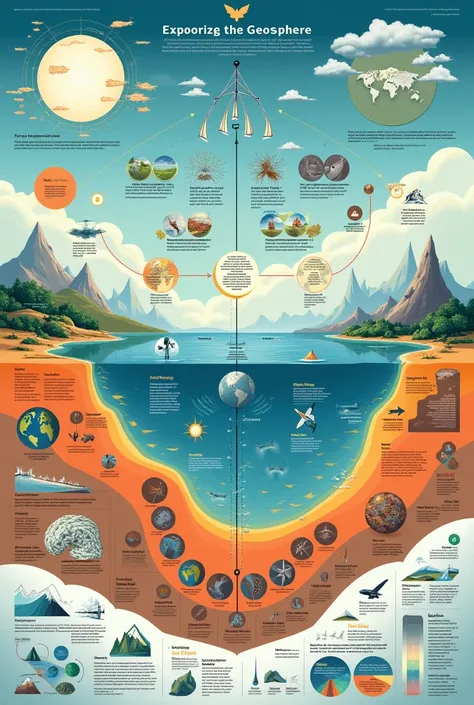
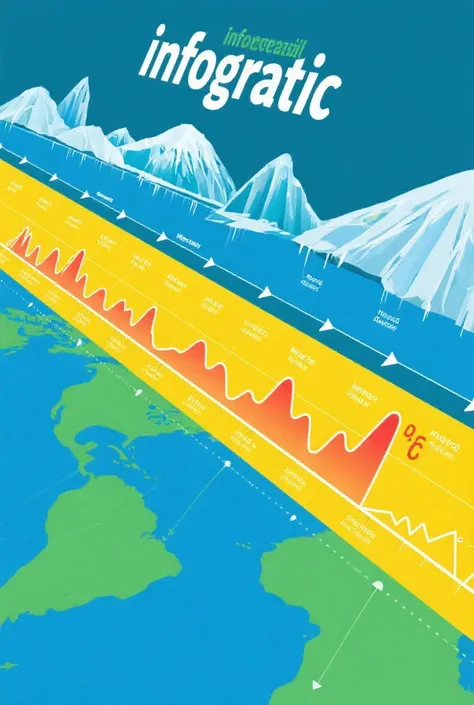
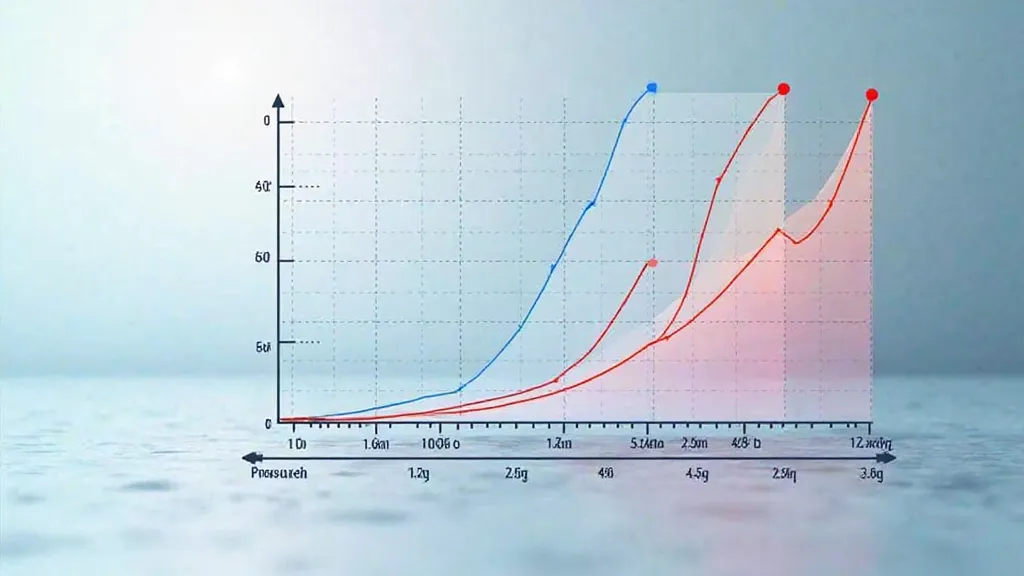
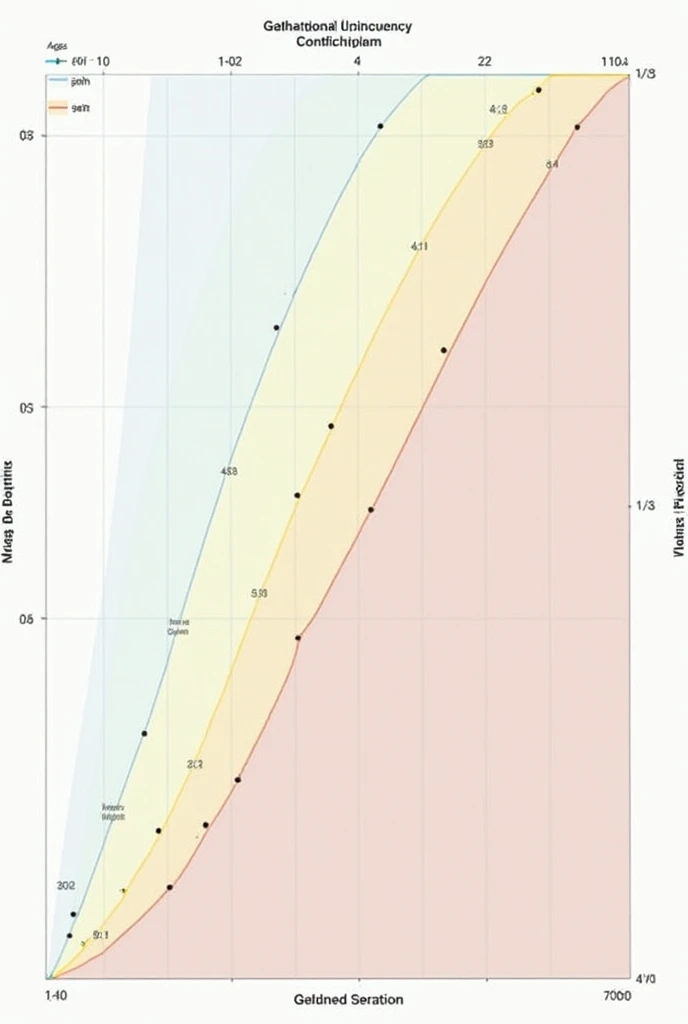
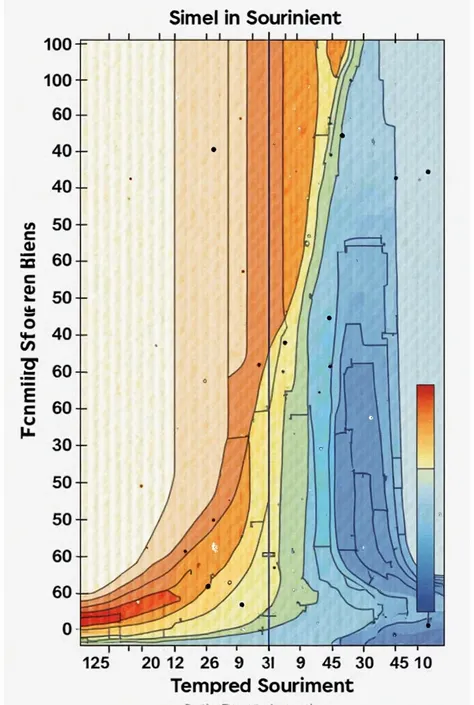
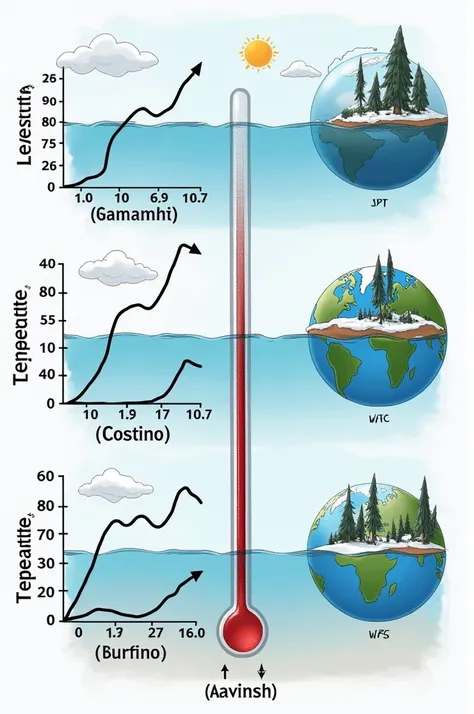
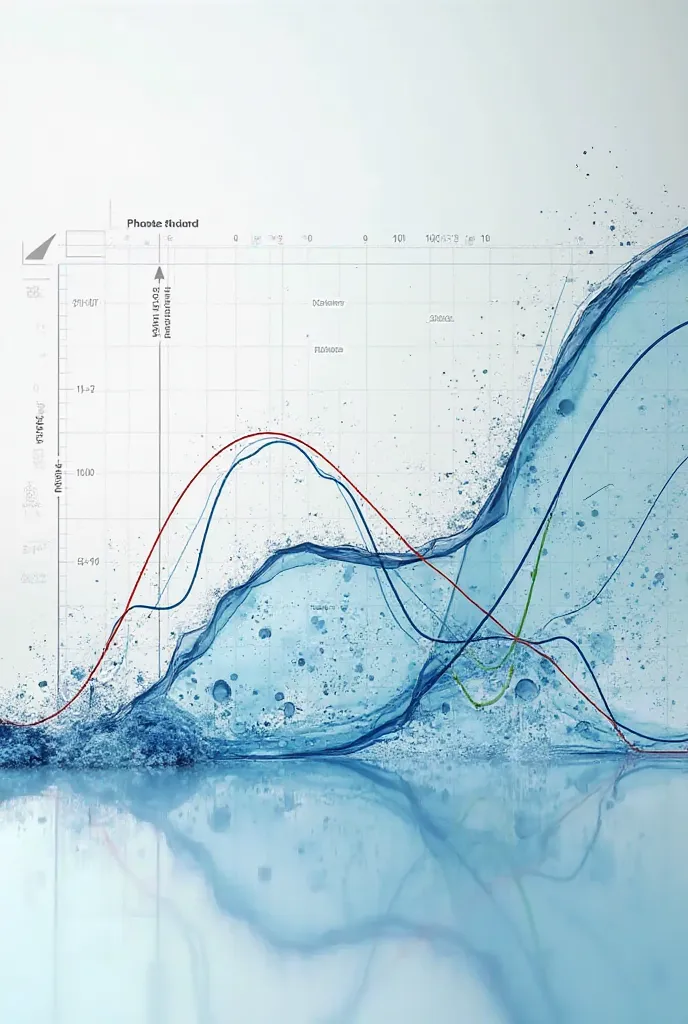
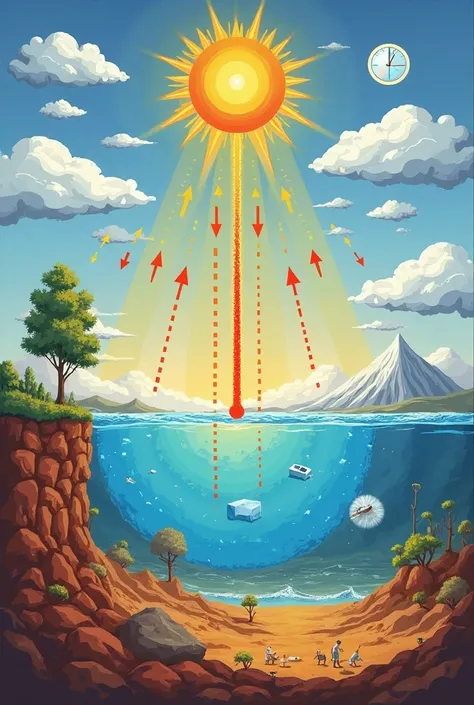
Illustrate a three-dimensional graph showing the relationship between the solubility of a substance (in grams per liter) and the temperature (in degrees Celsius). The horizontal axis represents the temperature, the vertical axis the solubility, and the depth axis can display different substances or types of solvents. Uses an ascending curve to reflect how solubility increases with temperature in most cases. Add different lines or colors for each substance represented, with clear labels to indicate their name and specific characteristics. In the background, includes a visual representation of a crystal dissolving in a liquid to provide visual context about the dissolution process
S
Generation Data
Records
Prompts
Copy
Illustrate a three-dimensional graph showing the relationship between the solubility of a substance (in grams per liter) and the temperature (in degrees Celsius)
.
The horizontal axis represents the temperature
,
the vertical axis the solubility
,
and the depth axis can display different substances or types of solvents
.
Uses an ascending curve to reflect how solubility increases with temperature in most cases
.
Add different lines or colors for each substance represented
,
with clear labels to indicate their name and specific characteristics
.
In the background
,
includes a visual representation of a crystal dissolving in a liquid to provide visual context about the dissolution process
INFO
Checkpoint & LoRA

Checkpoint
SeaArt Infinity
#Landscape
#SeaArt Infinity
0 comment
0
0
0
SeaArt Swift AI Apps

AI Video Generation
Unleash your imagination and let AI create visual wonders for you

Face Swap Online Free
Create funny or realistic face swap videos & photos in a snap

Virtual Try on Clothes
Try on any type of clothes virtually with AI.
Studio Ghibli Filter
Transform any photo into unique Ghibli-style art in just one click.

AI Filters
Turns every photo into a work of art

Wan 2.1 Image to Video
Animate photos with realistic motion and cinematic effects.
Explore More AI Apps