"A line graph showing the relationship between interest rates and inflation over


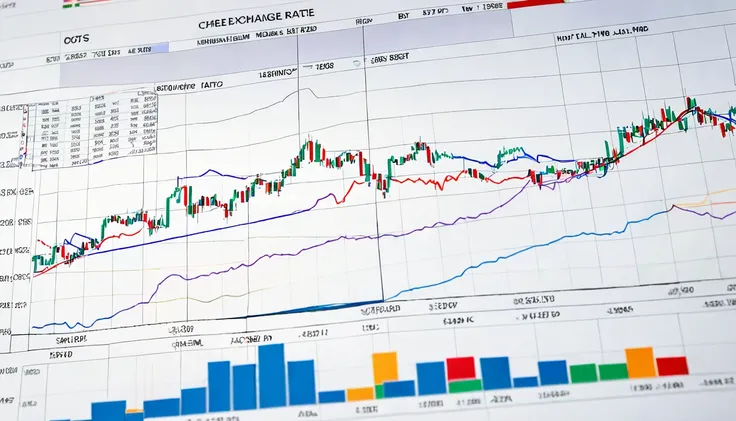
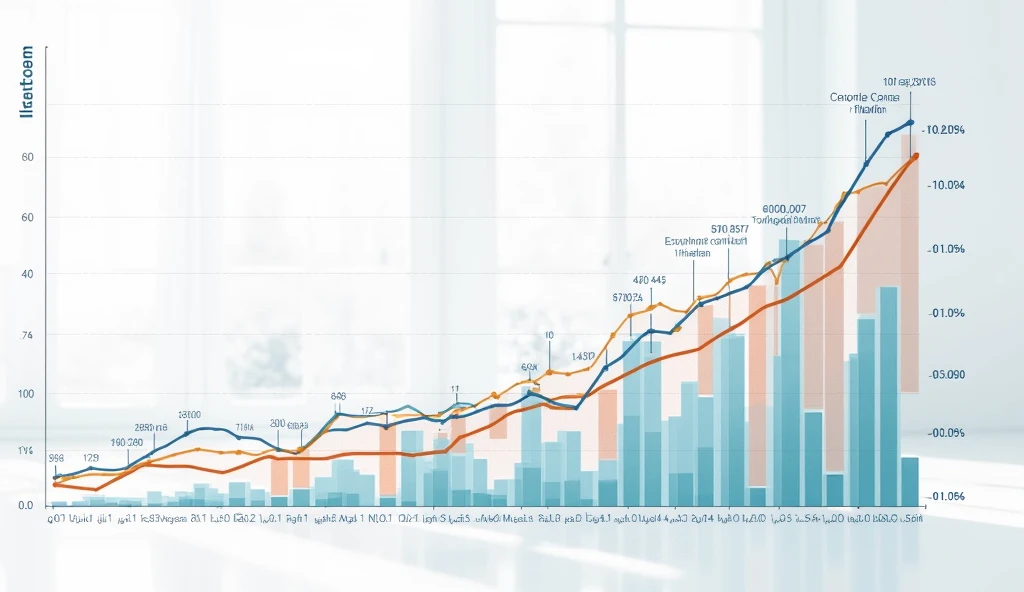
"A line graph showing the relationship between interest rates and inflation over time. The graph should depict how central banks use interest rate adjustments to control inflation, with clear labels and a clean design. Annotations could highlight key periods of interest rate changes."
Generation Data
Enregistrements
Prompts
Copier les Paramètres
"A line graph showing the relationship between interest rates and inflation over time
.
The graph should depict how central banks use interest rate adjustments to control inflation
,
with clear labels and a clean design
.
Annotations could highlight key periods of interest rate changes
.
"
Info
Checkpoint & LoRA

Checkpoint
SeaArt Infinity
#Dessin animé
#SeaArt Infinity
0 commentaire(s)
1
0
0
Apps AI Rapides de SeaArt

Génération de Vidéos AI
Libérez votre imagination, l'AI crée des miracles visuels pour vous.

Échangez le visage gratuitement en ligne
Créez des vidéos et des photos hilarantes & réalistes en échangeant le visage rapidement

Filtre Ghibli
Transformez n'importe quelle photo en art de style Ghibli unique en un seul clic.

Créateur d'Avatar Cartoon
Transformez vos photos en avatars cartoon uniques instantanément.

Générateur de Vidéos de Baiser AI
Rejoignez la tendance des baisers avec le générateur de vidéos de baiser AI de SeaArt. Faites facilement s'embrasser deux personnes et créez une animation réaliste.

Filtres AI
Transformer chaque photo en œuvre d'art
Explorer plus d'applications AI