banner_image ×
SeaArt AI Entreprise

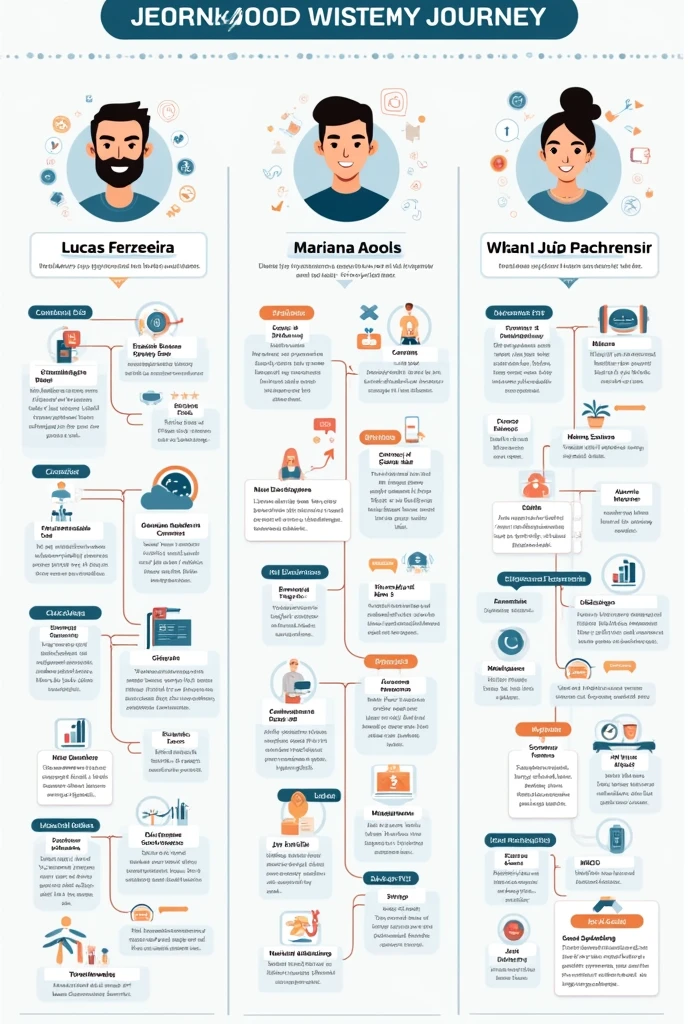
To create a visual map of the customer journey based on the information provided

to create a visual map of the customer journey based on the information provided to Lucas Ferreira, Mariana Santos and João Oliveira, You can follow a template that illustrates each stage of the consumer journey and how it unfolds for each persona. Here is an example of how you can structure and visualize the map:

Visual Map of the Consumer Journey 1. Lucas Ferreira Discovery:

fountain: Instagram Ad Content: Highlight the gamification of training Consideration:

questions: The app is really fun? The challenges are suitable for my level?
Action: Review Search and Demo Video Viewing Decision:

Action: Decide to try the app after positive reviews and video Experience:

feelings: Gosta dos desafios e da sensação de progressão
Action: Keep training with the Post-Purchase app:

Action: Share on social media and recommend to friends 2. Mariana Santos Discovery:

fountain: Research in Facebook groups of physical education teachers Contents: Seeking new teaching tools Consideration:

questions: The app can be integrated into classes? Students will get involved?
Action: Try the app for free Decision:

Action: Purchase the premium version after seeing the students' excitement Experience:

feelings: Alunos mais engajados e motivados
Action: Improves the dynamics of post-purchase classes:

Action: Publishes blog article and shares at conferences 3. João Oliveira Discovery:

fountain: Recommendation from a colleague on LinkedIn Content: Wellness Apps Consideration:

questions: The app fits my schedule? Offers quick workouts?
Action: Decide to test the Decision app:

Action: Test the application attracted by the combination of challenges and efficiency Experience:

feelings: Surpreendido com a facilidade de encaixar os treinos
Action: Include the app in your daily routine Post-purchase:

Action: Recommend the app in professional groups Map View To create an effective visualization, you can use a graphic design tool or
chatIcon
Il y a des choses que je ne peux vous dire qu'à voix basse, ça vous intéresse ?
Créer un Compagnon AI
image
avatar
J
Juan antonio
Generation Data
Enregistrements
Prompts
Copier les Paramètres
to create a visual map of the customer journey based on the information provided to Lucas Ferreira , Mariana Santos and João Oliveira , You can follow a template that illustrates each stage of the consumer journey and how it unfolds for each persona . Here is an example of how you can structure and visualize the map: Visual Map of the Consumer Journey 1 . Lucas Ferreira Discovery: fountain: Instagram Ad Content: Highlight the gamification of training Consideration: questions: The app is really fun ? The challenges are suitable for my level ? Action: Review Search and Demo Video Viewing Decision: Action: Decide to try the app after positive reviews and video Experience: feelings: Gosta dos desafios e da sensação de progressão Action: Keep training with the Post-Purchase app: Action: Share on social media and recommend to friends 2 . Mariana Santos Discovery: fountain: Research in Facebook groups of physical education teachers Contents: Seeking new teaching tools Consideration: questions: The app can be integrated into classes ? Students will get involved ? Action: Try the app for free Decision: Action: Purchase the premium version after seeing the students&#39 ; excitement Experience: feelings: Alunos mais engajados e motivados Action: Improves the dynamics of post-purchase classes: Action: Publishes blog article and shares at conferences 3 . João Oliveira Discovery: fountain: Recommendation from a colleague on LinkedIn Content: Wellness Apps Consideration: questions: The app fits my schedule ? Offers quick workouts ? Action: Decide to test the Decision app: Action: Test the application attracted by the combination of challenges and efficiency Experience: feelings: Surpreendido com a facilidade de encaixar os treinos Action: Include the app in your daily routine Post-purchase: Action: Recommend the app in professional groups Map View To create an effective visualization , you can use a graphic design tool or
Info
Prompts
to create a visual map of the customer journey based on the information provided to Lucas Ferreira, Mariana Santos and João Oliveira, You can follow a template that illustrates each stage of the consumer journey and how it unfolds for each persona. Here is an example of how you can structure and visualize the map: Visual Map of the Consumer Journey 1. Lucas Ferreira Discovery: fountain: Instagram Ad Content: Highlight the gamification of training Consideration: questions: The app is really fun? The challenges are suitable for my level? Action: Review Search and Demo Video Viewing Decision: Action: Decide to try the app after positive reviews and video Experience: feelings: Gosta dos desafios e da sensação de progressão Action: Keep training with the Post-Purchase app: Action: Share on social media and recommend to friends 2. Mariana Santos Discovery: fountain: Research in Facebook groups of physical education teachers Contents: Seeking new teaching tools Consideration: questions: The app can be integrated into classes? Students will get involved? Action: Try the app for free Decision: Action: Purchase the premium version after seeing the students' excitement Experience: feelings: Alunos mais engajados e motivados Action: Improves the dynamics of post-purchase classes: Action: Publishes blog article and shares at conferences 3. João Oliveira Discovery: fountain: Recommendation from a colleague on LinkedIn Content: Wellness Apps Consideration: questions: The app fits my schedule? Offers quick workouts? Action: Decide to test the Decision app: Action: Test the application attracted by the combination of challenges and efficiency Experience: feelings: Surpreendido com a facilidade de encaixar os treinos Action: Include the app in your daily routine Post-purchase: Action: Recommend the app in professional groups Map View To create an effective visualization, you can use a graphic design tool or
Échelle CFG
7
Étapes
25
Échantillonneur
euler
Graine Aléatoire
1068348136
Planificateur
karras
Dimension de l'Image
688 X 1024
Modèle
SeaArt Infinity
Créer
Taille
688X1024
Date
Aug 26, 2024
Mode
Studio
Type
cell
Checkpoint & LoRA
SeaArt Infinity
Checkpoint
SeaArt Infinity
#Dessin animé
#Conception de Produit
#SeaArt Infinity
0 commentaire(s)
1
0
0

Apps AI Rapides de SeaArt

ai_video_generationimg
Génération de Vidéos AI

Libérez votre imagination, l'AI crée des miracles visuels pour vous.

face_swap_titleimg
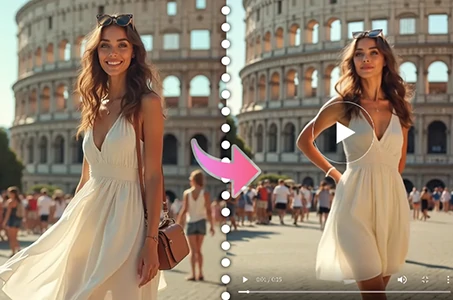
Échangez le visage gratuitement en ligne

Créez des vidéos et des photos hilarantes & réalistes en échangeant le visage rapidement

dance_vidimg
Générateur de Vidéos de Danse AI

Jouez avec ce générateur de vidéos de danse AI et libérez instantanément votre danseur intérieur !
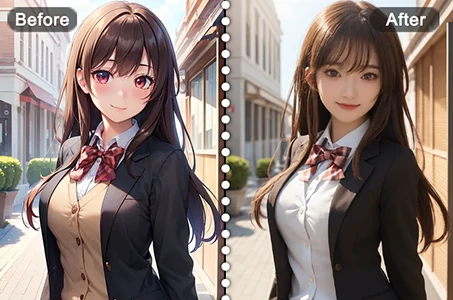
anime2realityimg
Anime vers Réalité

Donnez vie instantanément à vos personnages d'anime préférés.

image2lineartimg
Image en Art Linéaire

Convertissez sans effort n'importe quelle image en élégant art linéaire.

fuse_anyoneimg
Fusion d'Images AI

Combinez deux images en une nouvelle création visuelle époustouflante avec la Fusion d'Images AI.

Explorer plus d'applications AI 

Suggestions

ControlNet
logo
Français
Applications
Générer l'image Compagnons AI IA Swift Entraînement de modèle Canvas Outil Rapide Flux de Travail
À propos de lui/elle
Studio Classement AI Chat Blog AI Actualités AI
Aide
Tutoriel Service clientèle
Obtenir l'Application
icon
Download on the
APP Store
icon
GET IT ON
Google Play
Suivez-Nous
iconiconiconiconiconiconiconicon
© 2025 SeaArt, Inc.
Copyright Policy
Conditions d'utilisation
Politique de confidentialité 特定商取引法 資金決済法に基づく表示
Plus