Visual: A futuristic dashboard full of dynamic charts, Performance Indicators
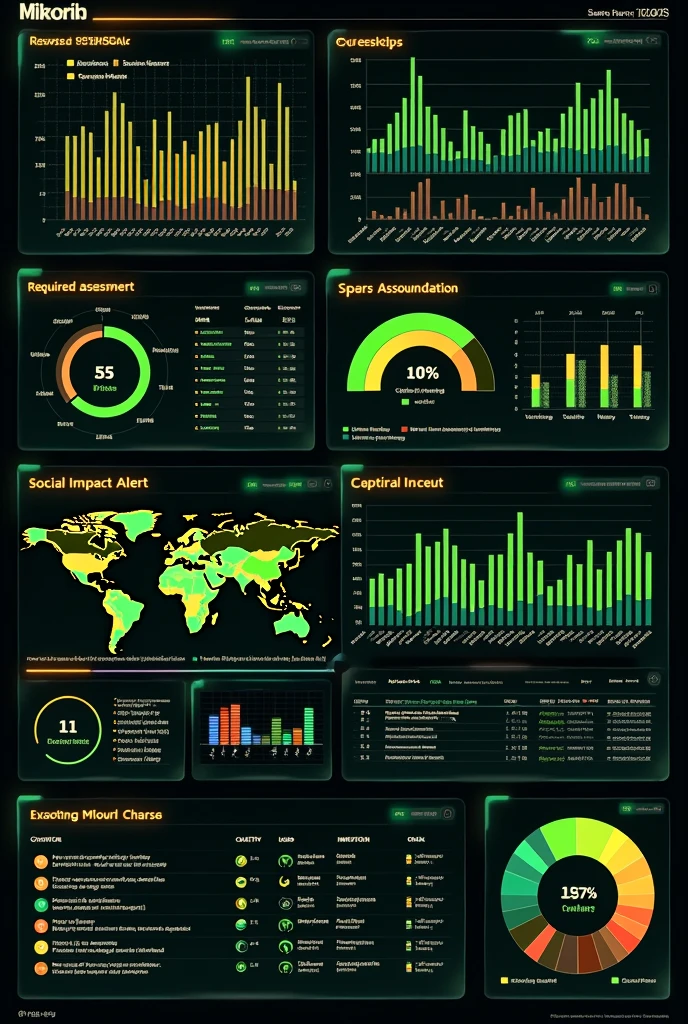


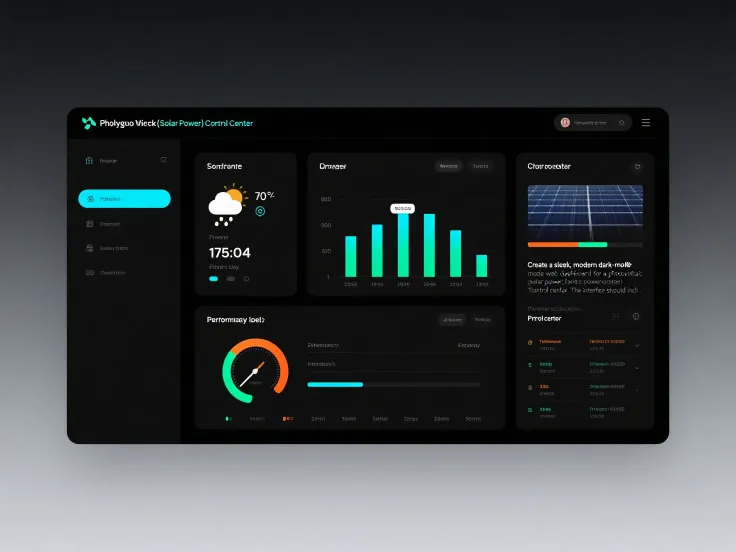
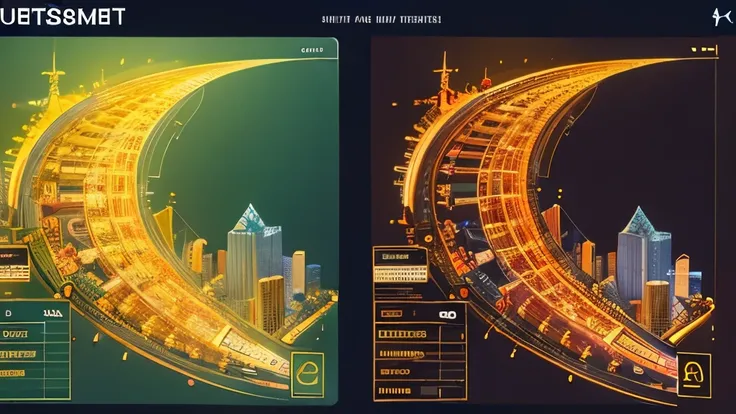
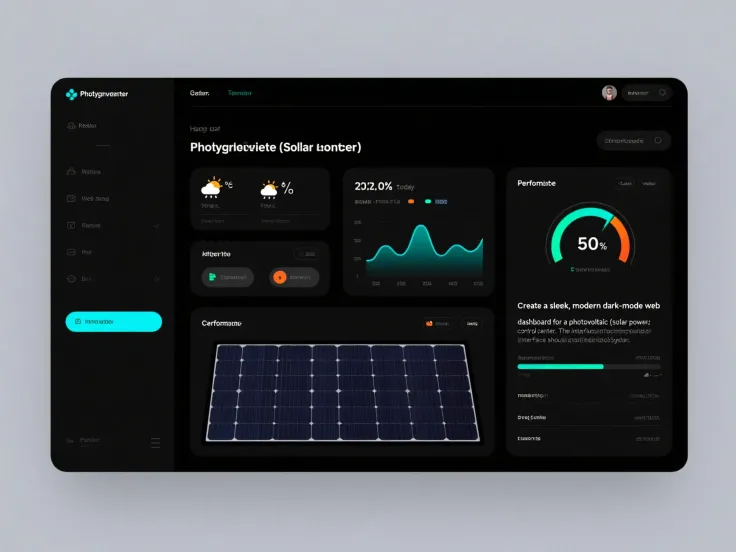
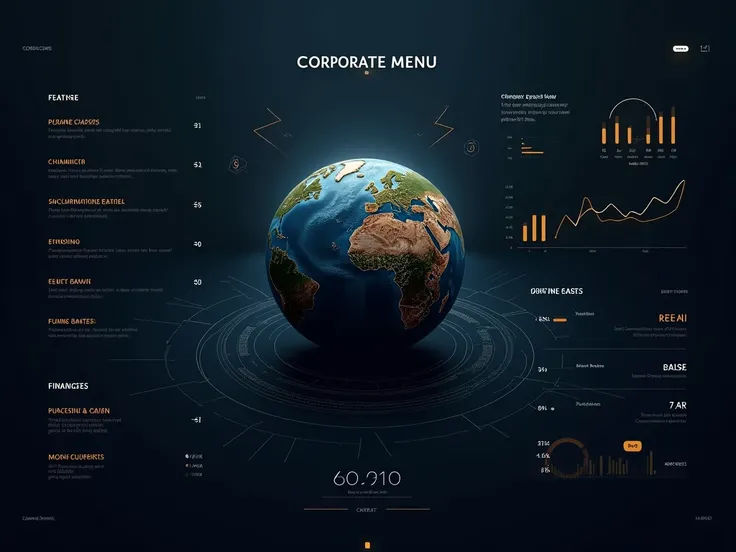
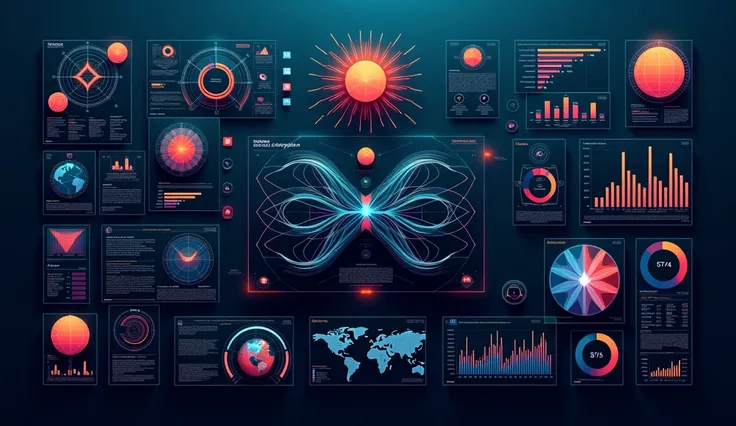
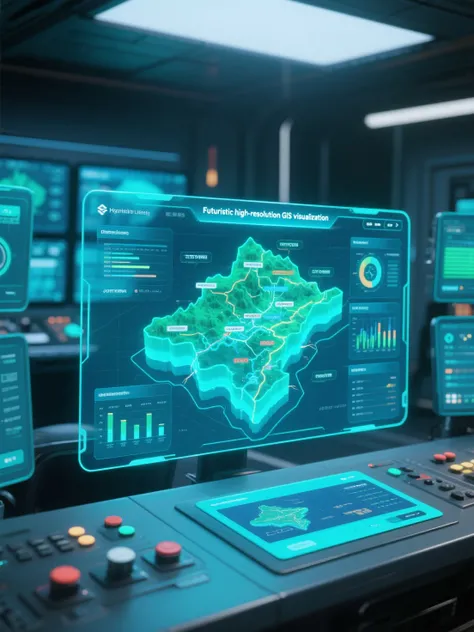
visual: A futuristic dashboard full of dynamic charts, Performance Indicators, and alerts that show the evaluation and monitoring of an AI system. The interface is clear, with real-time graphs and colorful alerts. colors: A combination of black, lime, and fluorescent orange, resembling an advanced control system. elements: Graphs as bars, Trendlines, and pie charts that change as the reader scrolls through the poster, showing different aspects of AI monitoring. Red alerts that appear highlighting risks and recommendations, as “Required Assessment” and “Social Impact Alert”.
Generation Data
บันทึก
คำพรอมต์
คัดลอกคำพรอมต์
visual: A futuristic dashboard full of dynamic charts
,
Performance Indicators
,
and alerts that show the evaluation and monitoring of an AI system
.
The interface is clear
,
with real-time graphs and colorful alerts
.
colors: A combination of black
,
lime
,
and fluorescent orange
,
resembling an advanced control system
.
elements:
Graphs as bars
,
Trendlines
,
and pie charts that change as the reader scrolls through the poster
,
showing different aspects of AI monitoring
.
Red alerts that appear highlighting risks and recommendations
,
as “Required Assessment” and “Social Impact Alert”
.
ข้อมูล
Checkpoint & LoRA
Checkpoint
SeaArt Infinity
#Sci-Fi
# ไซเบอร์พังค์
#SeaArt Infinity
0 ความคิดเห็น
0
0
0
แอป SeaArt Swift AI

การสร้างวิดีโอด้วย AI
ปลดปล่อยจินตนาการของคุณและให้ AI สร้างสรรค์สิ่งมหัศจรรย์ทางภาพให้คุณ

เปลี่ยนใบหน้าออนไลน์ฟรี
สร้างวิดีโอและภาพถ่ายเปลี่ยนใบหน้าที่สนุกและสมจริงอย่างรวดเร็ว

ลองเสื้อผ้าแบบเสมือนจริง
ลองเสื้อผ้าทุกประเภทแบบเสมือนจริงด้วย AI

จากอนิเมะสู่ความเป็นจริง
ปลุกชีวิตให้ตัวละครอนิเมะที่คุณชื่นชอบได้ในทันที

เครื่องสร้างอวาตาร์การ์ตูน
เปลี่ยนภาพถ่ายของคุณให้กลายเป็นอวาตาร์การ์ตูนที่โดดเด่นได้ทันที

ตัวกรอง AI
ทำให้ภาพถ่ายทุกภาพกลายเป็นศิลปะ
สำรวจแอป AI อื่นๆ เพิ่มเติม