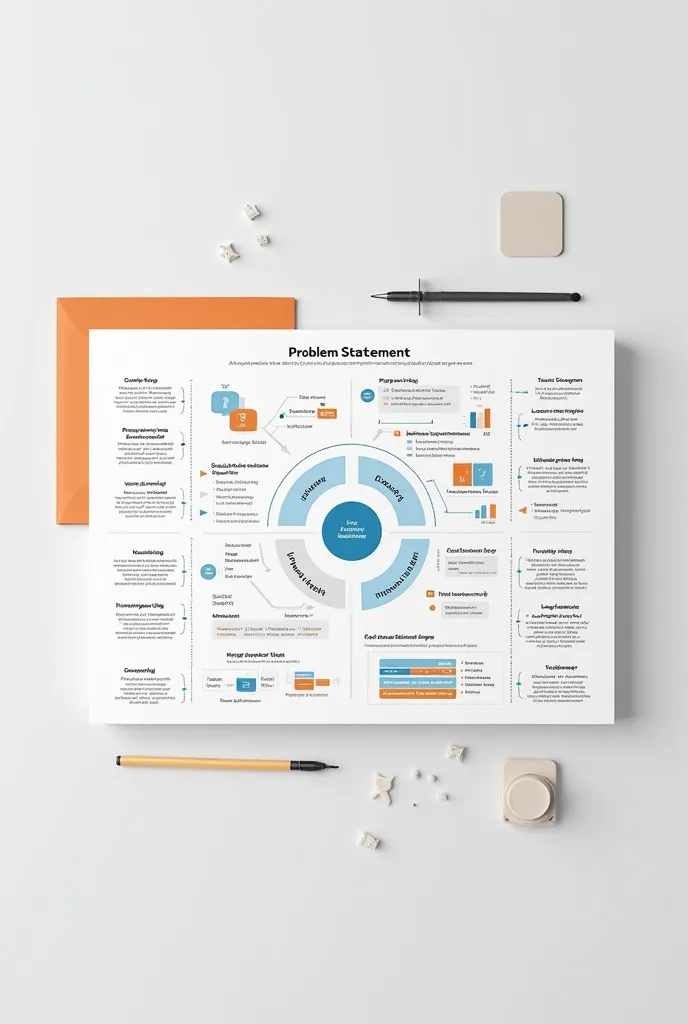
SWOT Analysis Infographic Chart. The strengths section shows strong math skills


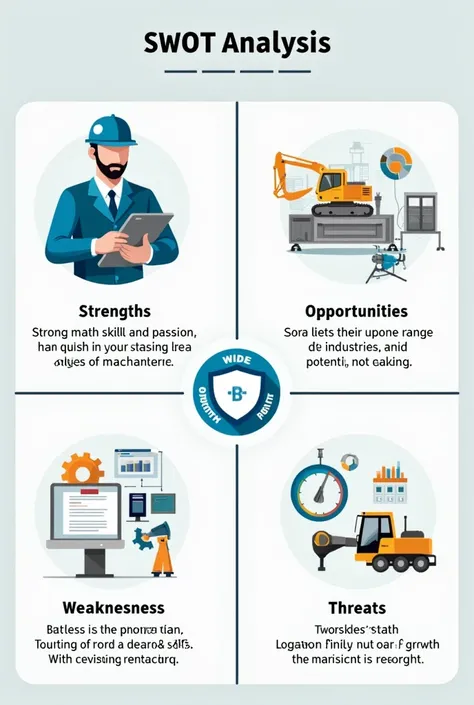
SWOT Analysis Infographic Chart. The strengths section shows strong math skills and a passion for machinery., while the opportunities section represents a wide range of industries and potential salary growth. Weaknesses and threats are also represented with relevant symbols..
كلمة التلميح
نسخ
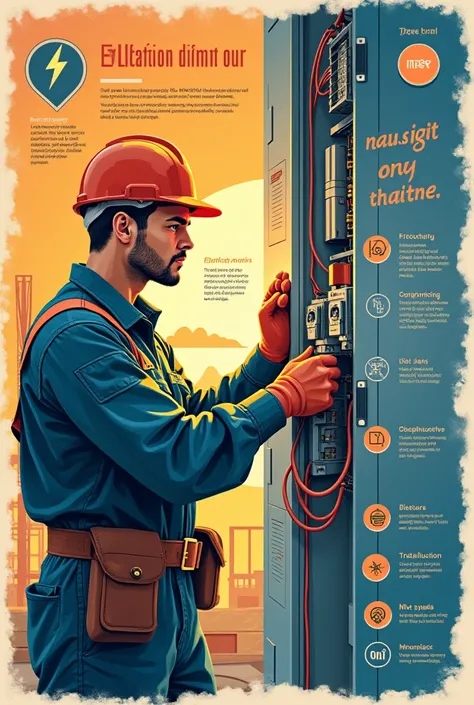
SWOT Analysis Infographic Chart
.
The strengths section shows strong math skills and a passion for machinery
.,
while the opportunities section represents a wide range of industries and potential salary growth
.
Weaknesses and threats are also represented with relevant symbols
..
معلومات
Checkpoint & LoRA

Checkpoint
SeaArt Infinity
#كرتون
#SeaArt Infinity
0 تعليق
0
1
0
تطبيقات الـAI السريعة من SeaArt

توليد فيديو AI
أطلق العنان لخيالك ودع AI يخلق روائع بصرية من أجلك.

مبادلة الوجه عبر الإنترنت مجانا
إبداع الفيديوهات والصور المضحكة أو الواقعية لمبادلة الوجه بسرعة

فلاتر AI
جعل كل صورة تصبح عملاً فنيًا

اندماج صورة الـAI
ادمج صورتين في صورة مذهلة جديدة باستخدام اندماج صورة الـAI.
تجربة الملابس الافتراضية
جرب أي نوع من الملابس افتراضيا باستخدام AI.

صانع أفاتار كرتوني
حوّل صورك إلى أفاتارات كرتونية فريدة على الفور.
استكشاف المزيد من تطبيقات الـAI