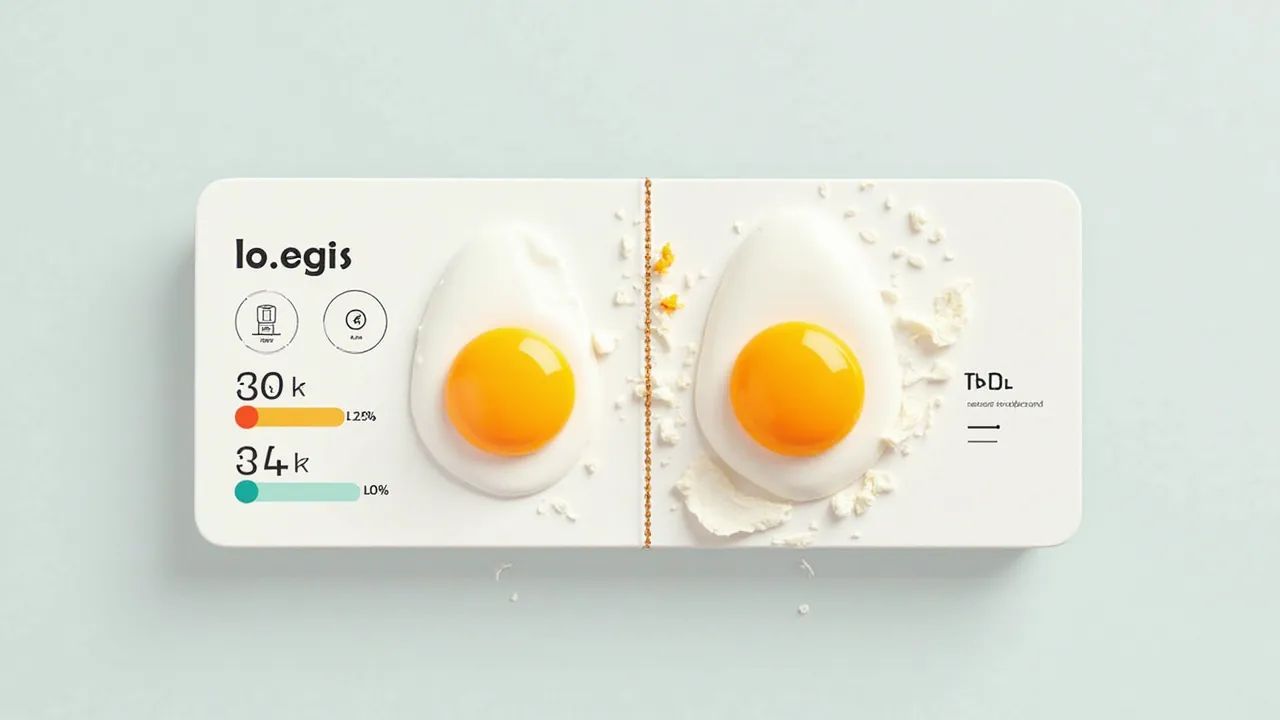
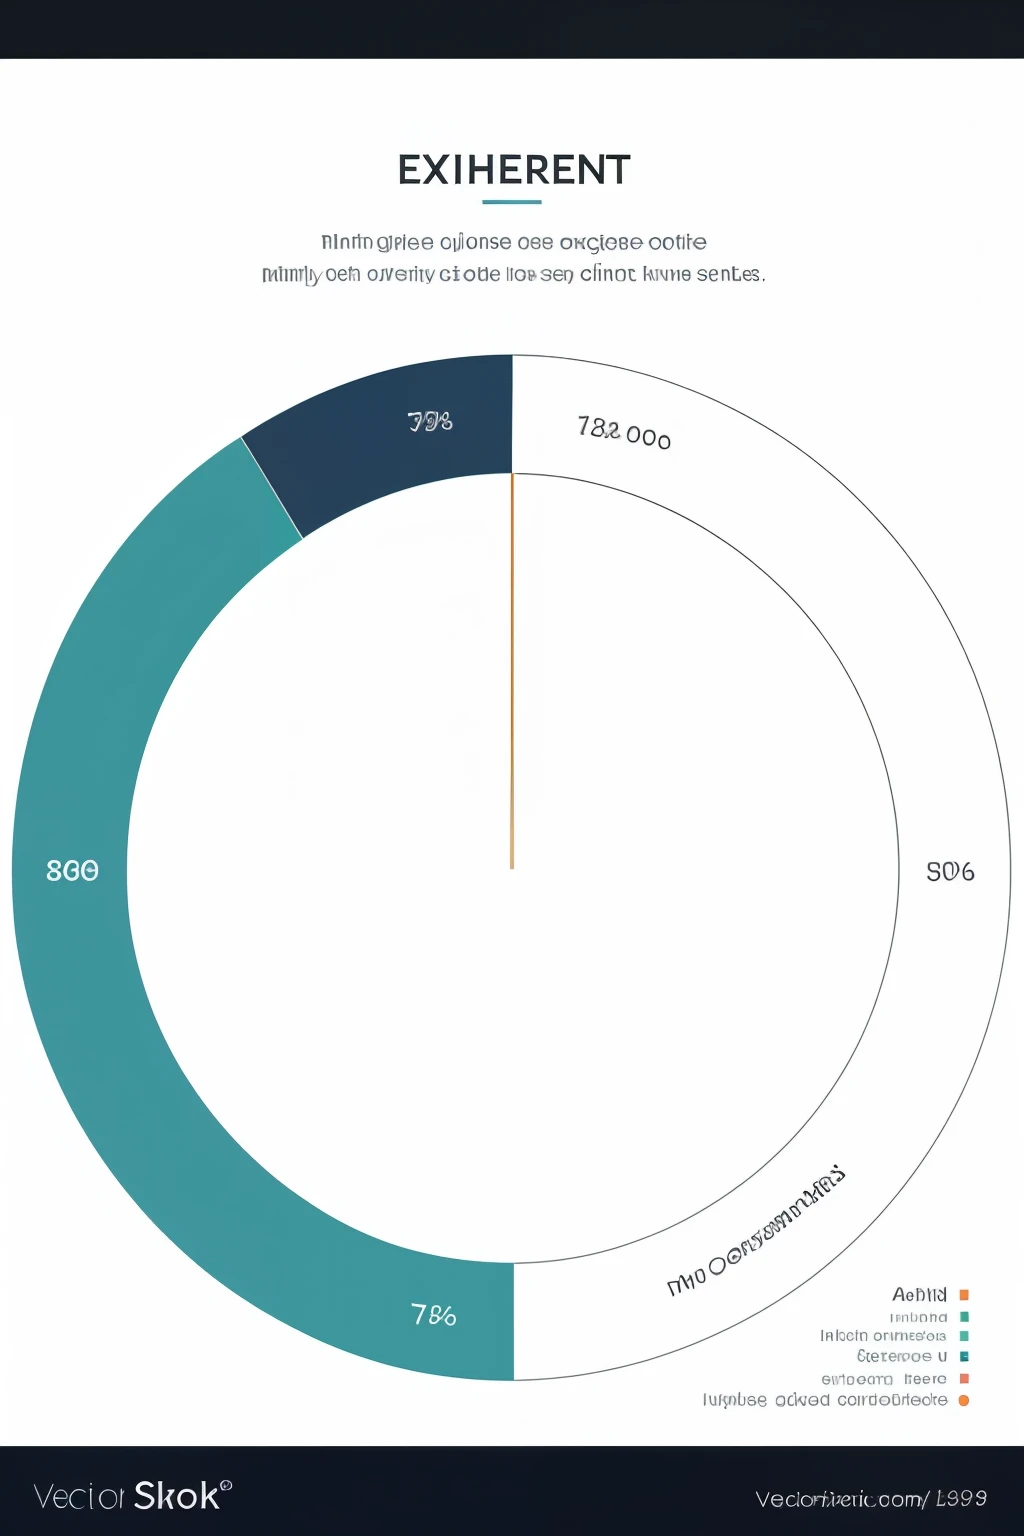
A pie chart showing the percentage of different types of people


Prompts
Prompts kopieren
Crafts an exquisitely detailed
,
high-definition pie chart meticulously depicting a comprehensive breakdown of expenses
,
showcasing a myriad of categories in stunning clarity
.
The chart is set against a classy
,
minimalist backdrop
,
with subtle gradients and clean lines that emphasize the precision and professionalism of the design
.
The chart is divided into twelve segments
,
each representing a distinct expense category
.
The segments are filled with rich
,
saturated colors
,
each radiating from the center
,
providing a captivating visual impact
.
The labels for each segment are carefully positioned to maximize readability
,
with a sleek
,
modern font that matches the overall aesthetic
.
The pie chart is set
Info
Checkpoint & LoRA

Checkpoint
epiCRealism
0 Kommentar(e)
0
0
0
SeaArt schnelle KI-Apps

KI-Video-Erstellung
Entfessle deine Fantasie und lass die KI visuelle Wunder für dich erschaffen.

Gesicht kostenlos tauschen
Erstelle lustige oder realistische Gesichtstausch-Viedeos und Fotos.

Von Anime zur Realität
Erwecke deine Lieblings-Anime-Charaktere sofort zum Leben.
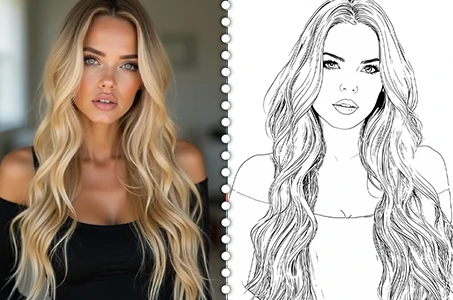
Bild zu Strichzeichnung
Verwandle mühelos jedes Bild in elegante Strichzeichnungen.

Geschlechtertausch
Tausche in Fotos und Videos das Geschlecht mit SeaArt KI-Geschlechtswechsler. Genieße unterhaltsame und realistische Transformationen mühelos und kostenlos online!
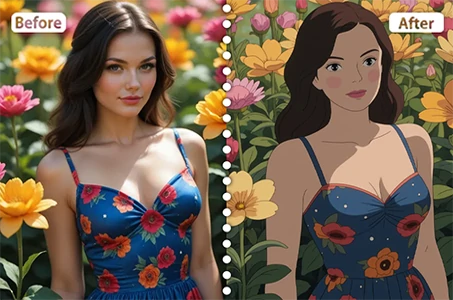
Studio-Ghibli-Filter
Verwandle jedes Foto mit nur einem Klick in einzigartige Ghibli-Style-Kunst.
Entdecke mehr KI-Apps