Constellation Project Architecture Chart Chart Description: smart meters


Constellation Project Architecture Chart Chart Description: smart meters (smart meters): Location: distributed throughout the network. Function: real-time measurement of energy consumption. SCADA (supervisory control and data acquisition) (supervisory control and data acquisition): Location: centralized node. Function: real-time monitoring and control of the electric grid. energy storage (energy storage): Location: distributed units at key nodes in the network. Function: energy storage and management to balance supply and demand. 5G networks: Location: connections between all major components. Function: high-speed, low-latency communication for real-time data. key connections: communication network: connections between meters, SCADA (supervisory control and data acquisition), and storage using 5G networks. energy flows: energy distribution from renewable sources through the grid to end consumers. this graphic illustrates the decentralized and modular structure of the project, highlighting how different components interact to improve the efficiency and resilience of the electric grid.no
Prompts
Prompts kopieren
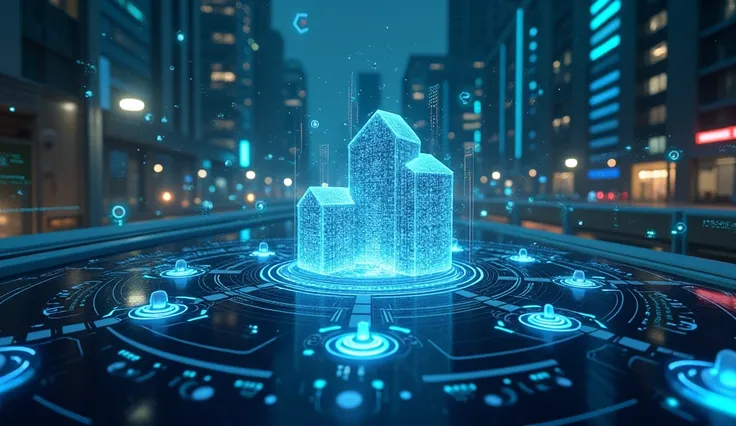
Constellation Project Architecture Chart Chart Description:
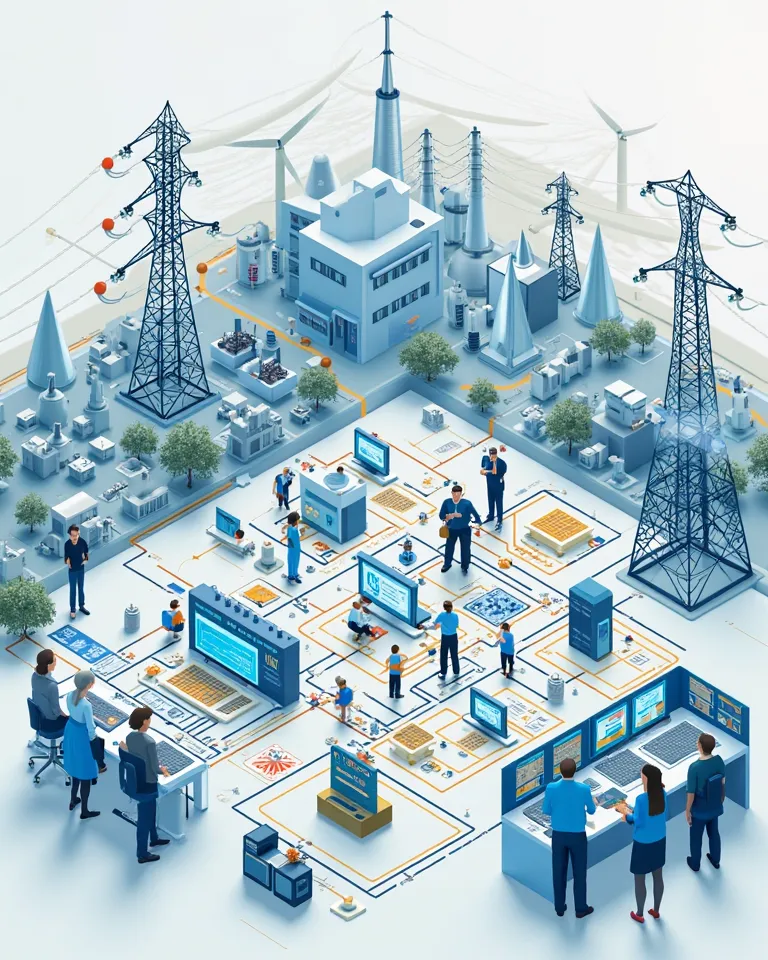
smart meters (smart meters):
Location: distributed throughout the network
.
Function: real-time measurement of energy consumption
.
SCADA (supervisory control and data acquisition) (supervisory control and data acquisition):
Location: centralized node
.
Function: real-time monitoring and control of the electric grid
.
energy storage (energy storage):
Location: distributed units at key nodes in the network
.
Function: energy storage and management to balance supply and demand
.
5G networks:
Location: connections between all major components
.
Function: high-speed
,
low-latency communication for real-time data
.
key connections:
communication network: connections between meters
,
SCADA (supervisory control and data acquisition)
,
and storage using 5G networks
.
energy flows: energy distribution from renewable sources through the grid to end consumers
.
this graphic illustrates the decentralized and modular structure of the project
,
highlighting how different components interact to improve the efficiency and resilience of the electric grid
.
no
Info
Checkpoint & LoRA

Checkpoint
SeaArt Infinity
#Cyberpunk
#Szenografie
#SeaArt Infinity
0 Kommentar(e)
0
0
0
SeaArt schnelle KI-Apps

KI-Gesichtstausch
Erkunde verschiedene Identitäten und entdecke dein neues Selbst mit einem Klick.

KI Bild Upscaler
Zaubere heute kristallklare Bilder!

Hintergrund entfernen
Entfernt den Hintergrund durch intelligente KI-Erkennung

KI-Text-zu-Bild-Generator
Verwandle einfache Worte in tolle Kunst.

KI-Porträt
Mit nur einem Klick kannst du unbegrenzte Porträts in verschiedenen Stilen freischalten

KI-Filter
Verwandelt jedes Foto in ein Kunstwerk
Entdecke unsere KI-Tools