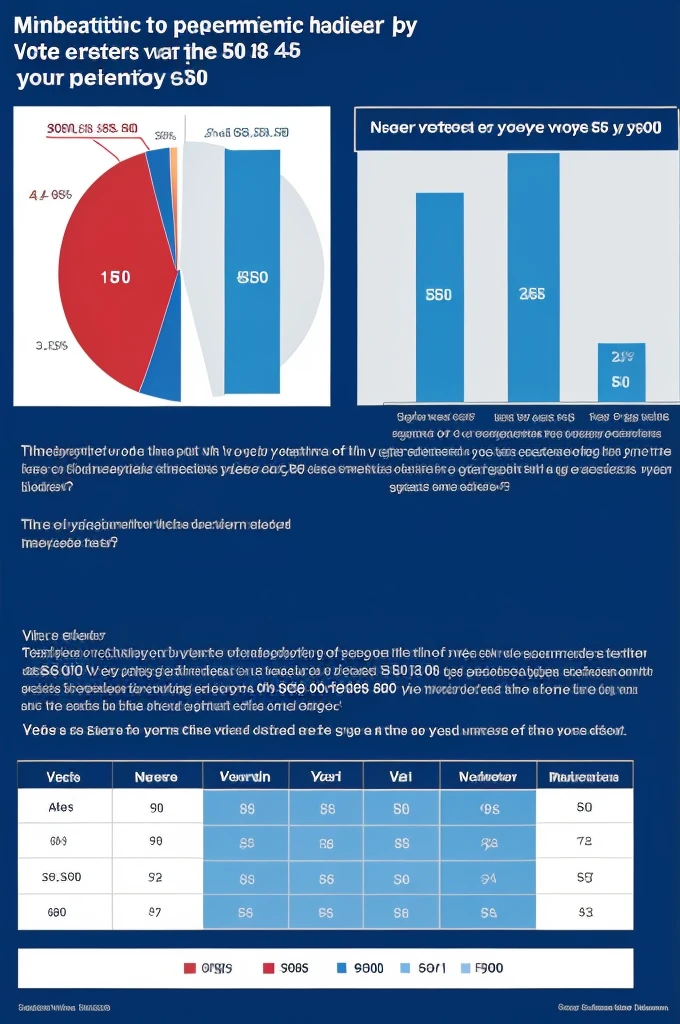
MATHEMATICS: 1. Show the number of voters in different categories and represent

Generation Data
Records
Prompts
Copy
MATHEMATICS:
1
.
Show the number of voters in different categories and represent this through Pie Chart
.
Voters Category (age wise) Number of voters
New Voters (18 year age)
30-40 years
40-50 years
50-60 years
above (Senior Citizens)
INFO
Checkpoint & LoRA

Checkpoint
AbsoluteRealIndian
0 comment
0
0
0


