A poster with a bunch of diagrams and information on it


"Produce an image that visually represents the application of statistical techniques in a data analysis context. Image must include graphics, scatter charts or other visual elements that illustrate statistical analysis of data. Make sure the image conveys the importance and usefulness of statistical techniques in understanding and making data-driven decisions."
Prompts
Copier les Paramètres
"Produce an image that visually represents the application of statistical techniques in a data analysis context
.
Image must include graphics
,
scatter charts or other visual elements that illustrate statistical analysis of data
.
Make sure the image conveys the importance and usefulness of statistical techniques in understanding and making data-driven decisions
.
"
Info
Checkpoint & LoRA
Checkpoint
ReV Animated
0 commentaire(s)
0
1
0
Apps AI Rapides de SeaArt

Génération de Vidéos AI
Libérez votre imagination, l'AI crée des miracles visuels pour vous.

Échangez le visage gratuitement en ligne
Créez des vidéos et des photos hilarantes & réalistes en échangeant le visage rapidement

Générateur de Vidéos de Baiser AI
Rejoignez la tendance des baisers avec le générateur de vidéos de baiser AI de SeaArt. Faites facilement s'embrasser deux personnes et créez une animation réaliste.

Filtres AI
Transformer chaque photo en œuvre d'art
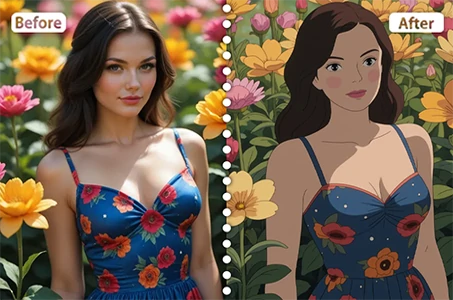
Filtre Ghibli
Transformez n'importe quelle photo en art de style Ghibli unique en un seul clic.
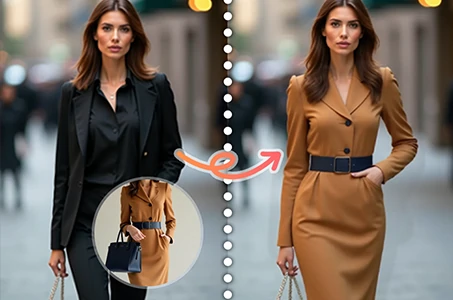
Essayage Virtuel de Vêtements
Essayez virtuellement tout type de vêtements avec l'AI.
Explorer plus d'applications AI