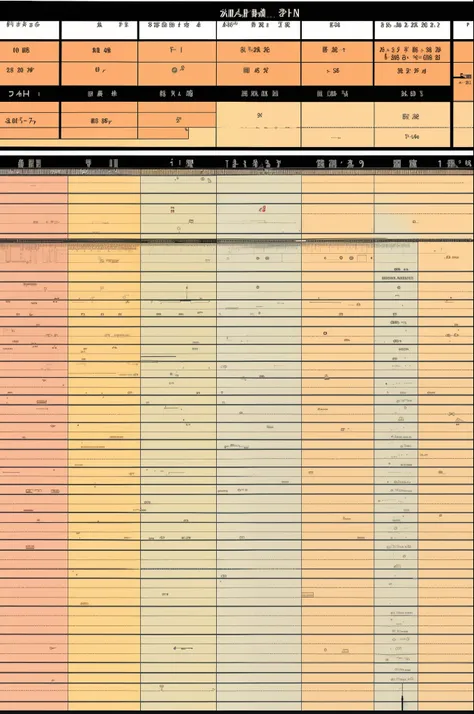
Mosaic of graphs and charts: Create a mosaic-style design using Tableau


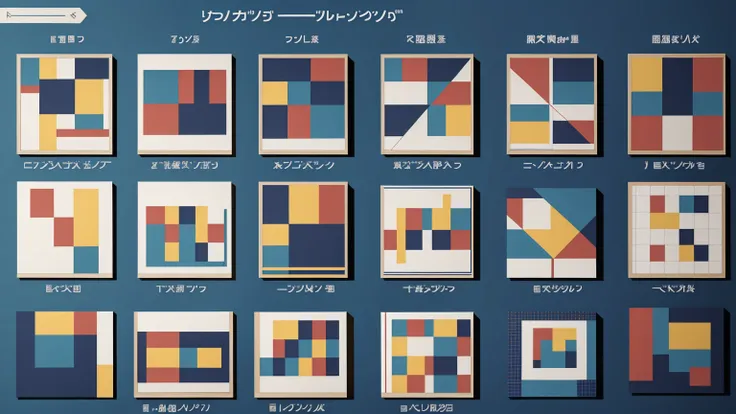
Mosaic of graphs and charts: Create a mosaic-style design using Tableau's brand colors, orange and white. Combine various data visualizations such as bar graphs, line charts, and pie charts to represent the diversity of data analysis.
Generation Data
履歴
プロンプト
プロンプトをコピー
Mosaic of graphs and charts: Create a mosaic-style design using Tableau's brand colors
,
orange and white
.
Combine various data visualizations such as bar graphs
,
line charts
,
and pie charts to represent the diversity of data analysis
.
情報
Checkpoint & LoRA

Checkpoint
GrandMix
#アニメ
コメント:0件
0
0
0