Create highly detailed and realistic images of modern data analysis dashboards
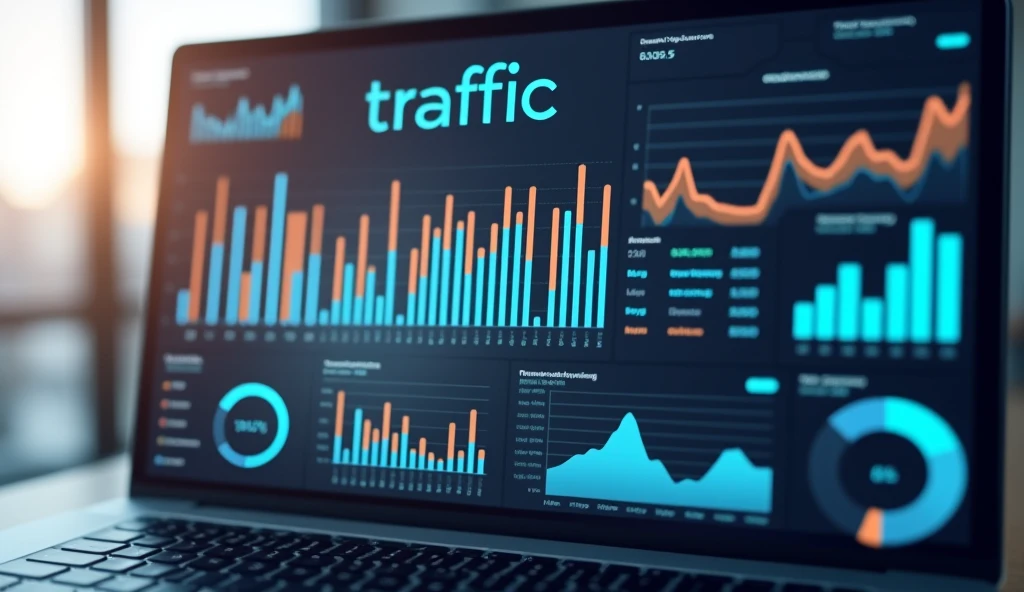

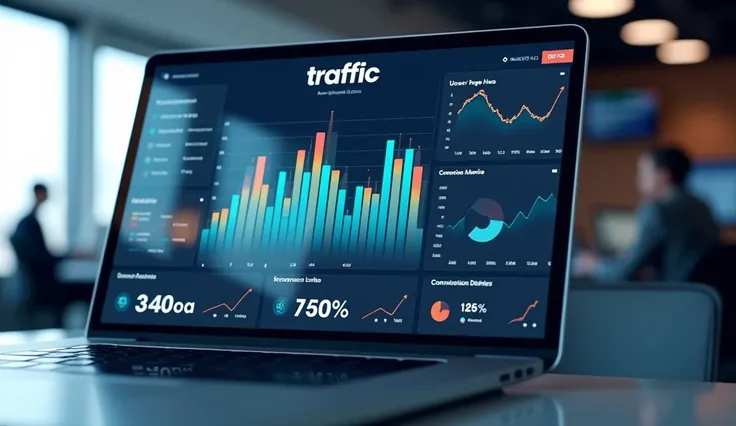
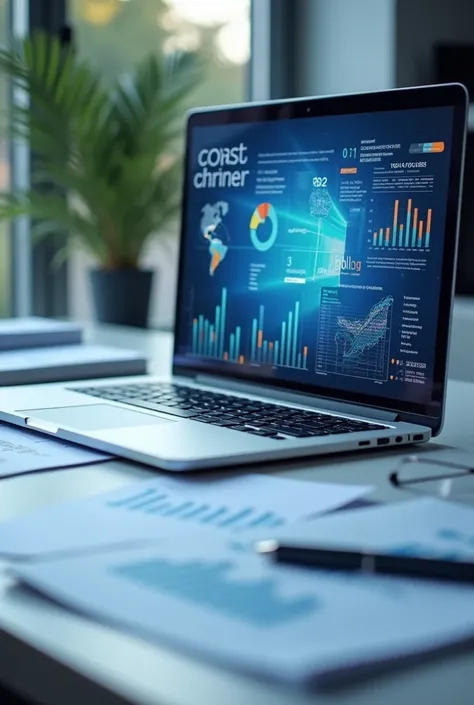
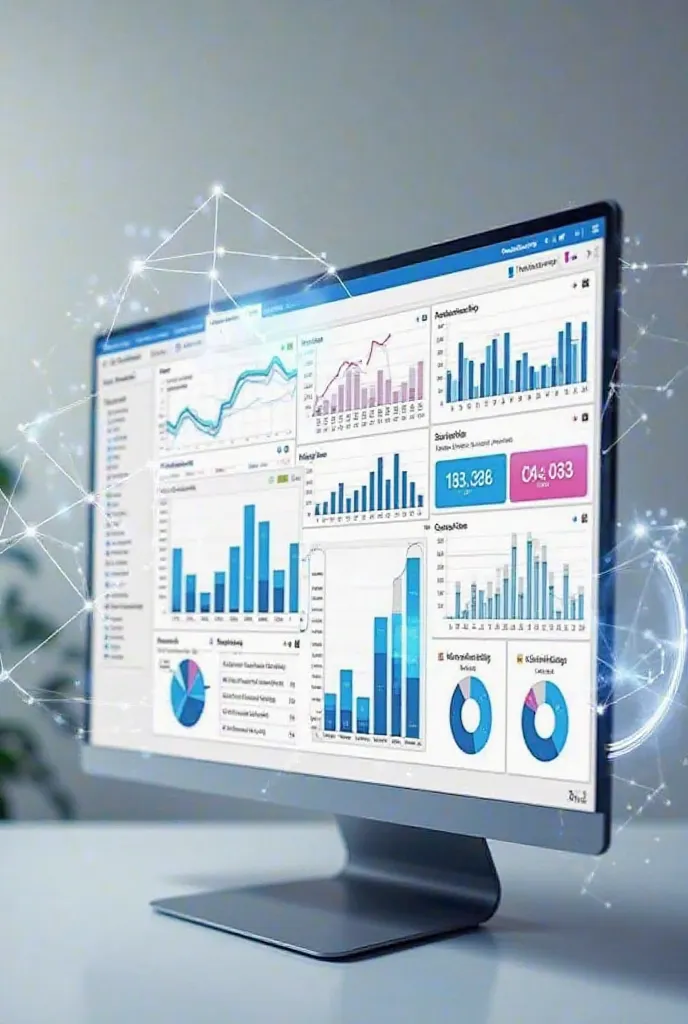
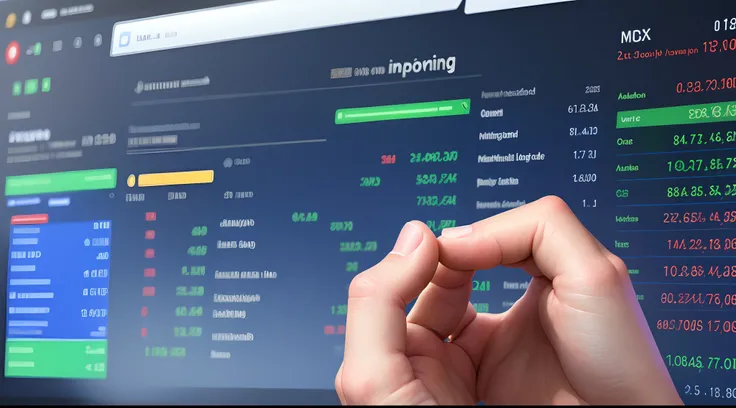
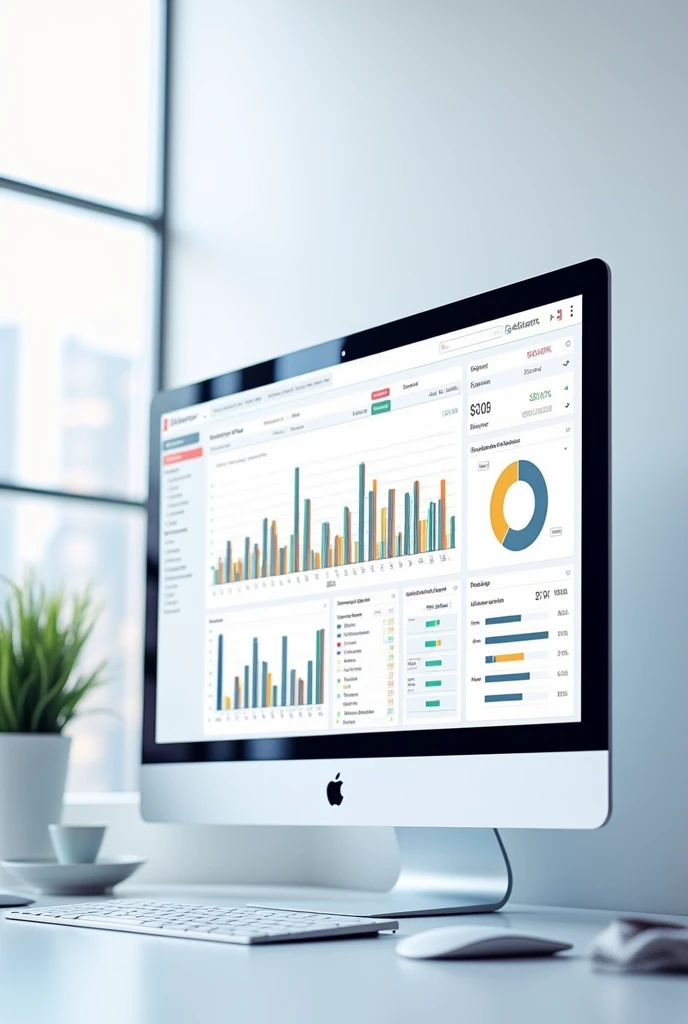
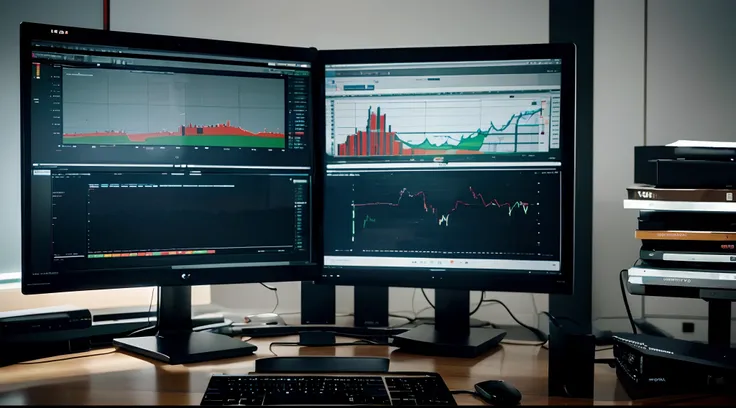
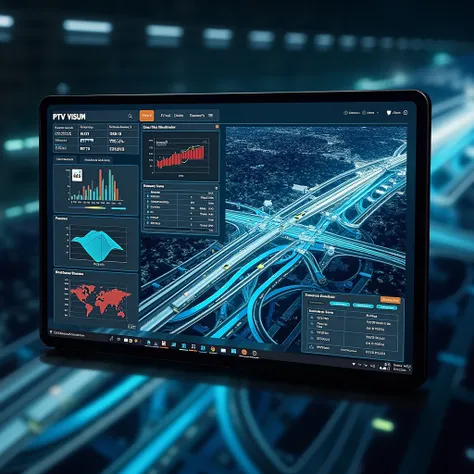
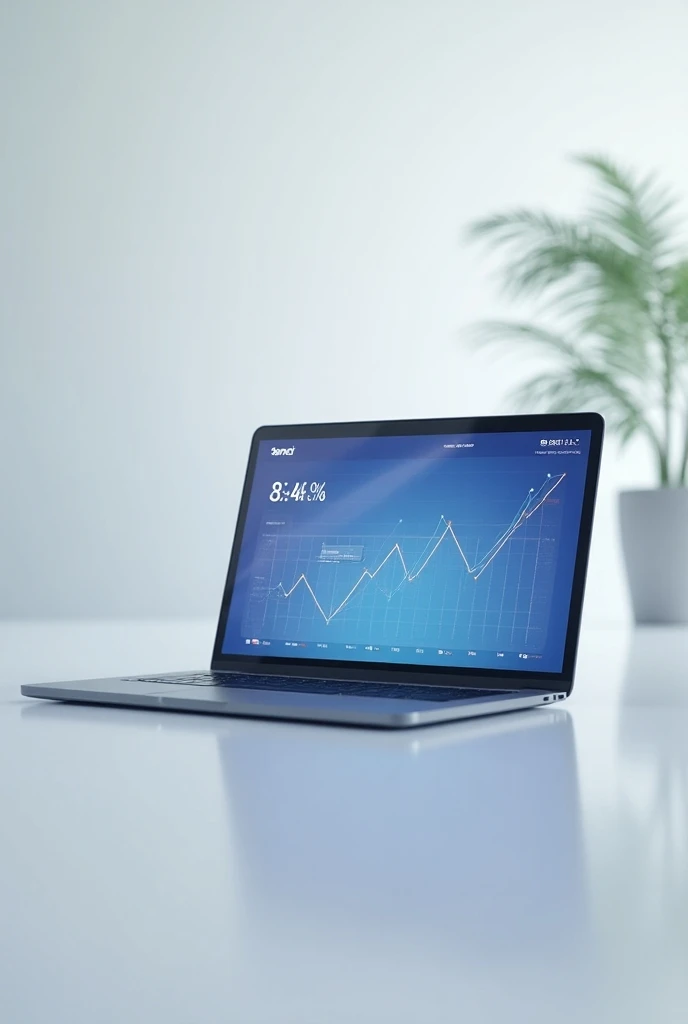
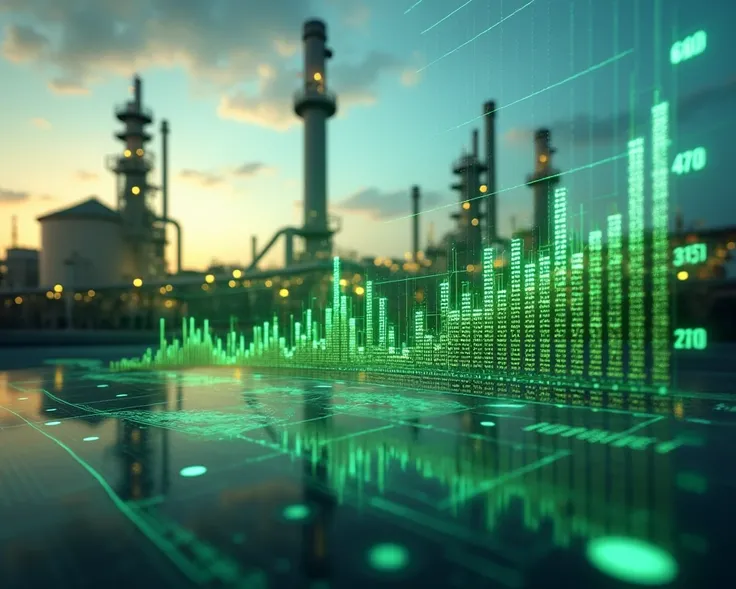
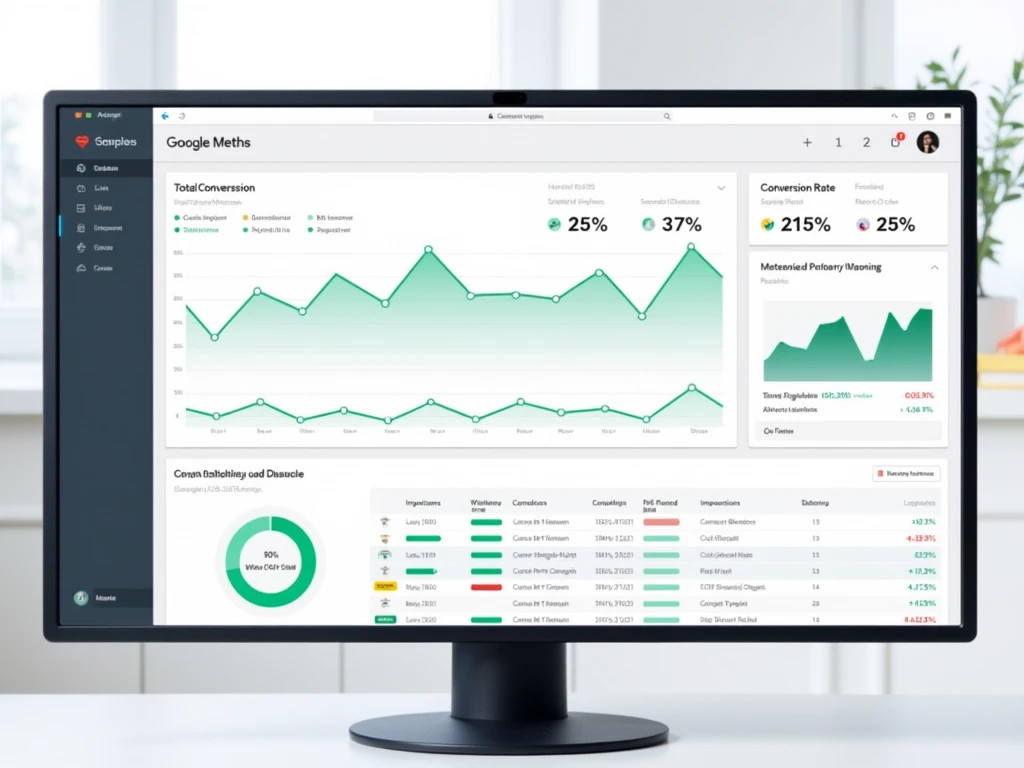
Create highly detailed and realistic images of modern data analysis dashboards, with a focus on traffic analysis. The dashboard should display a mix of bar charts, pie chart, and line graph, all in a sleek and professional design. The graph should display various metrics such as user visits., page view, bounce rate, and conversion ratio, with each graph color coded for clarity. The word 'TRAFFIC' should be displayed prominently at the top of the dashboard in bold, clean typography.. The overall design should convey an impression of high-tech efficiency., with sharp contrast and a slightly blurred background to emphasize the data on the screen.. The setting should be a modern office with natural lighting reflecting off the screen., gives a dynamic and realistic impression to the image
プロンプト
プロンプトをコピー
Create highly detailed and realistic images of modern data analysis dashboards
,
with a focus on traffic analysis
.
The dashboard should display a mix of bar charts
,
pie chart
,
and line graph
,
all in a sleek and professional design
.
The graph should display various metrics such as user visits
.,
page view
,
bounce rate
,
and conversion ratio
,
with each graph color coded for clarity
.
The word '
;
TRAFFIC'
;
should be displayed prominently at the top of the dashboard in bold
,
clean typography
..
The overall design should convey an impression of high-tech efficiency
.,
with sharp contrast and a slightly blurred background to emphasize the data on the screen
..
The setting should be a modern office with natural lighting reflecting off the screen
.,
gives a dynamic and realistic impression to the image
情報
Checkpoint & LoRA

Checkpoint
SeaArt Infinity
#リアリスティック
#SeaArt Infinity
コメント:0件
0
0
0


