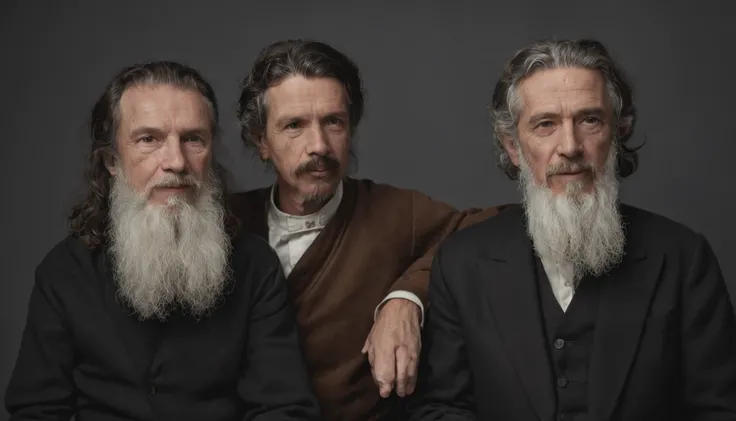
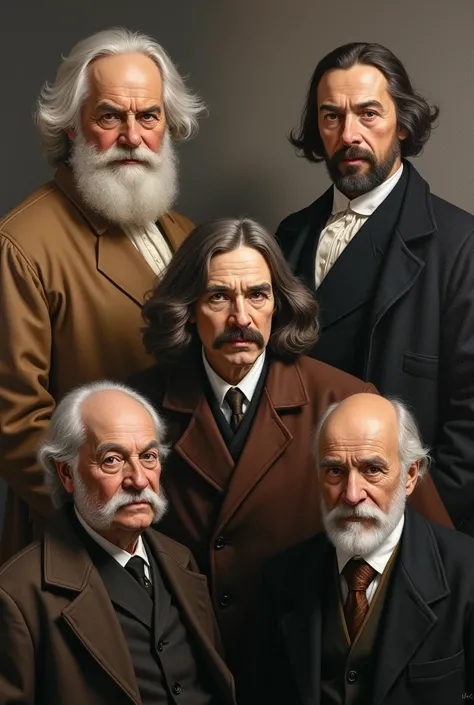
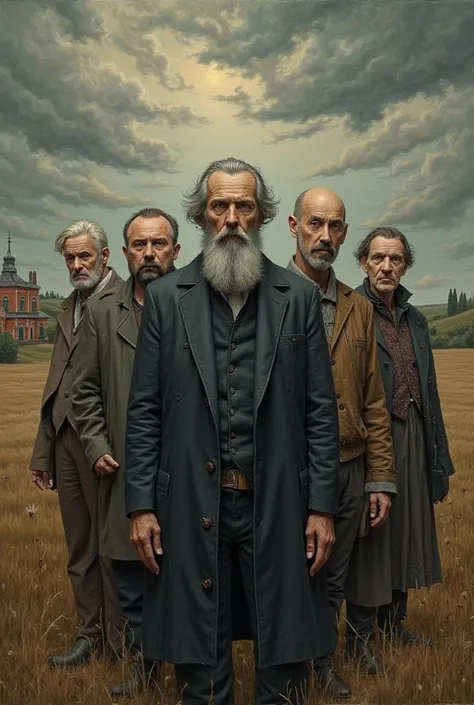
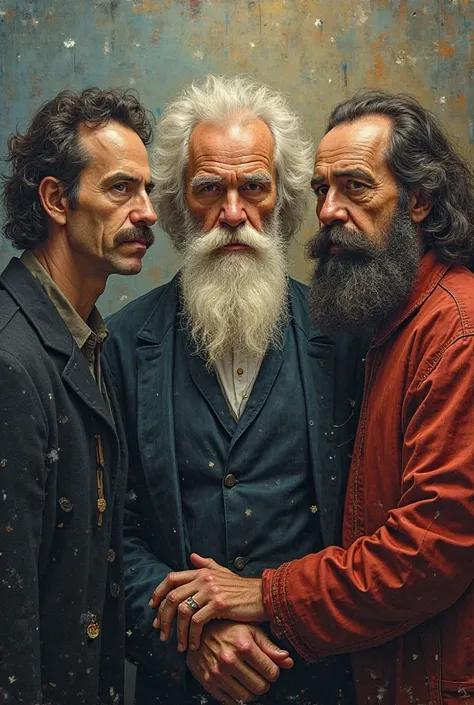
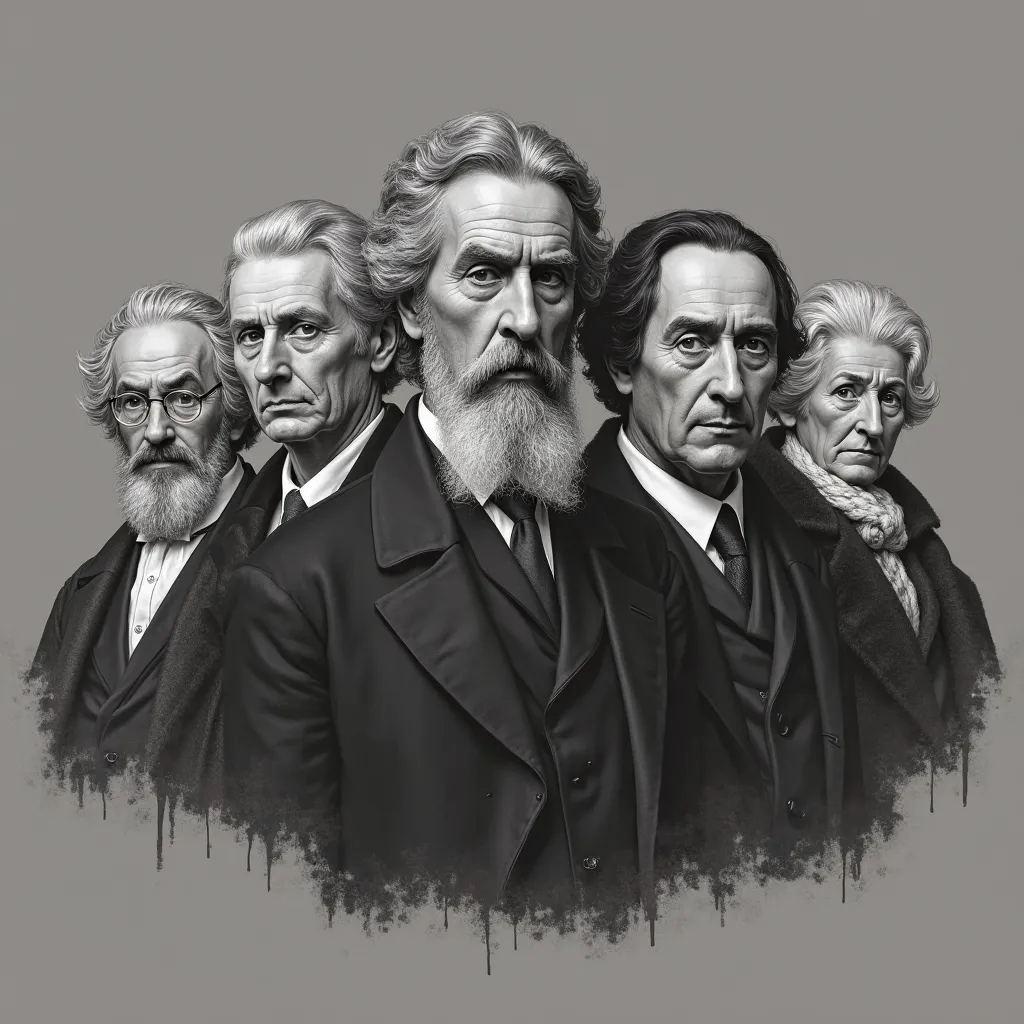
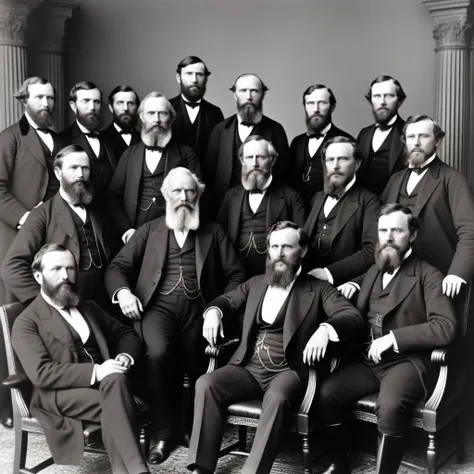
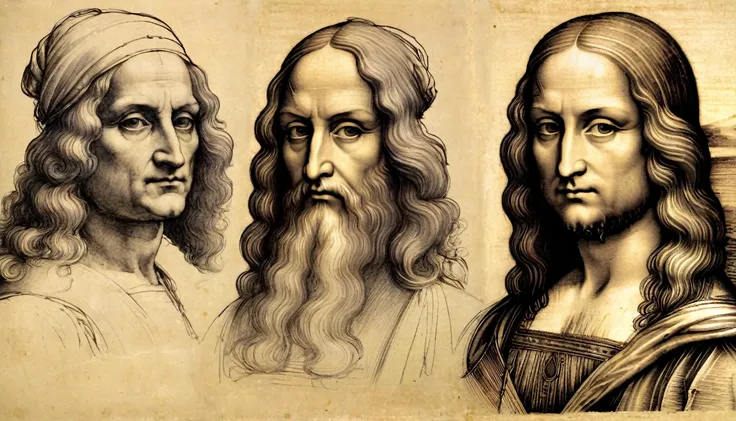
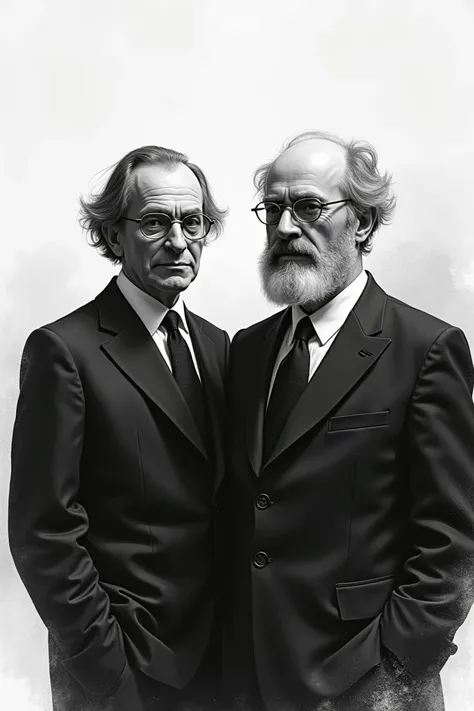
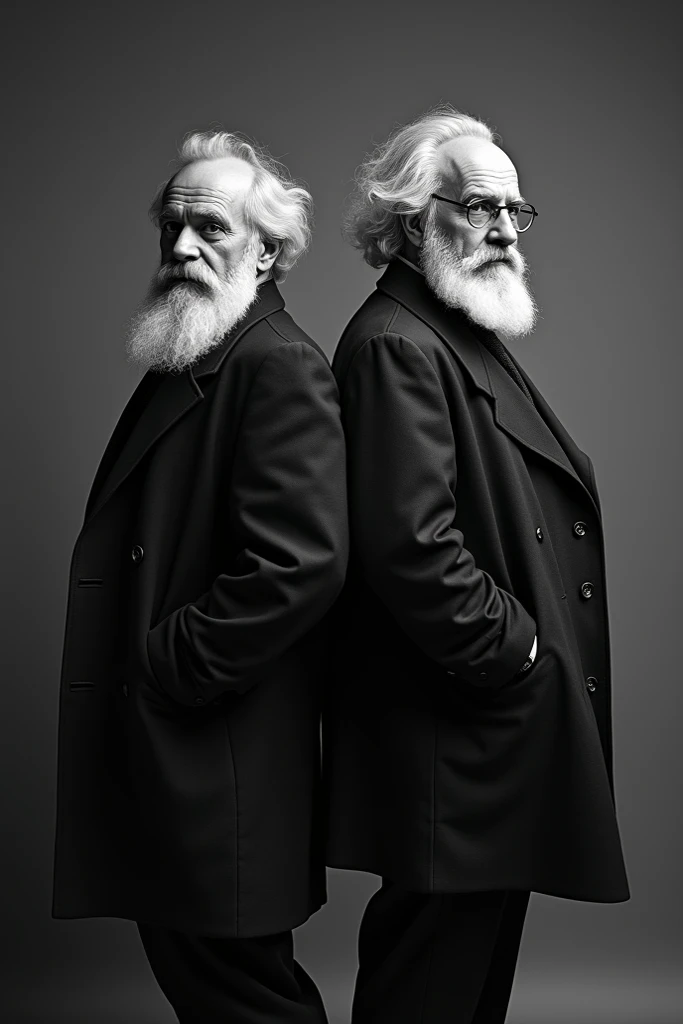
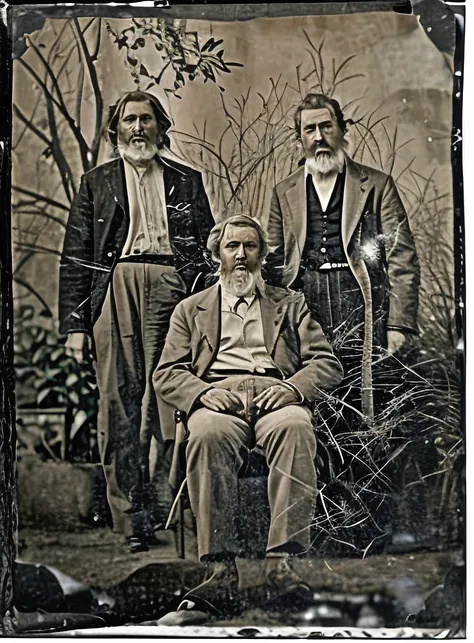
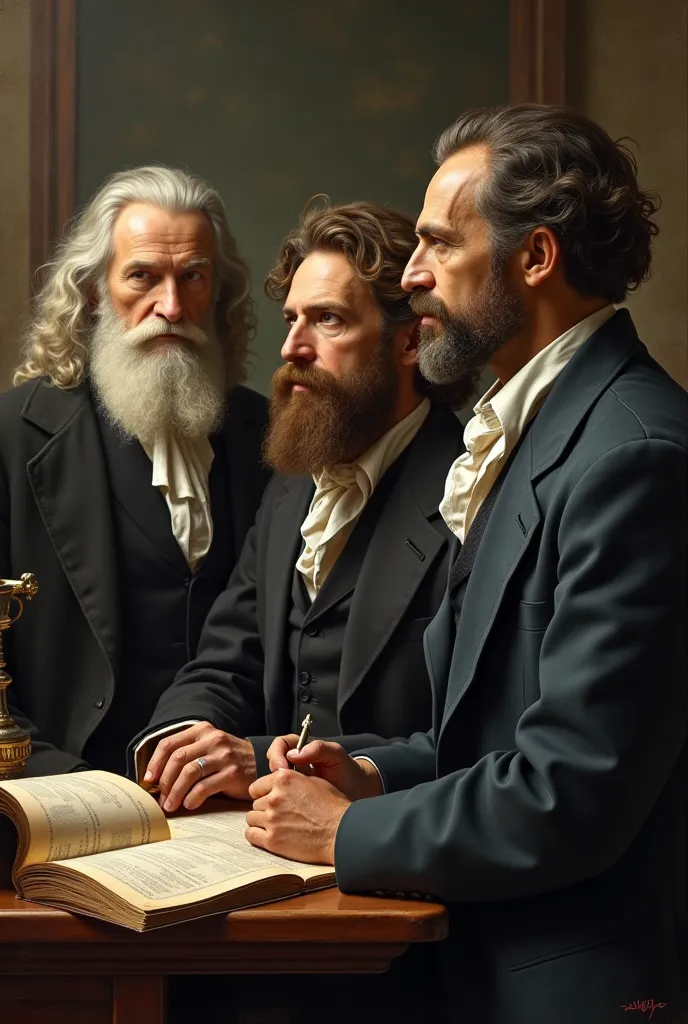
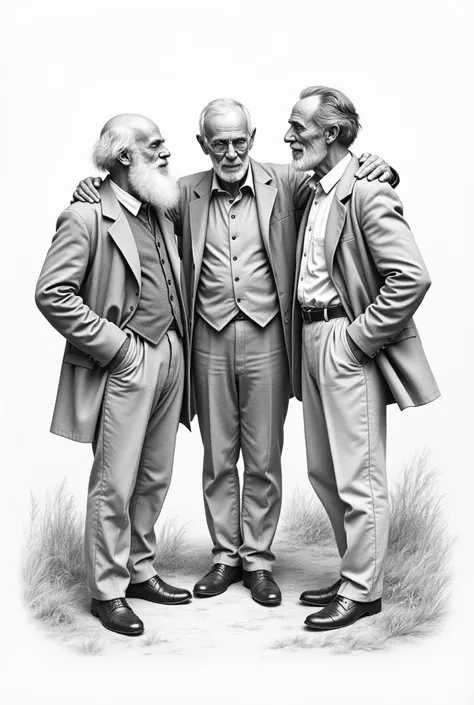
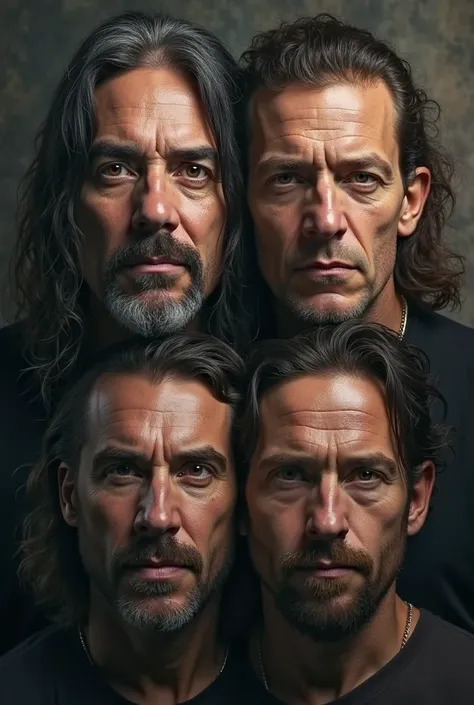
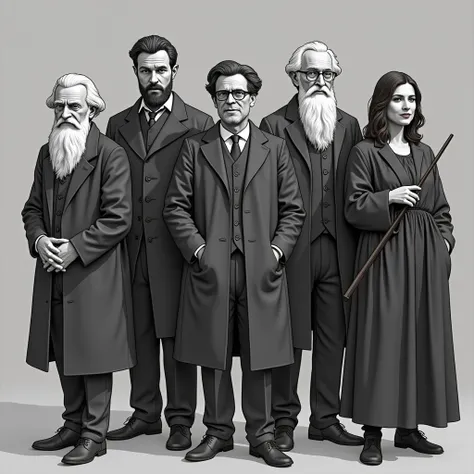
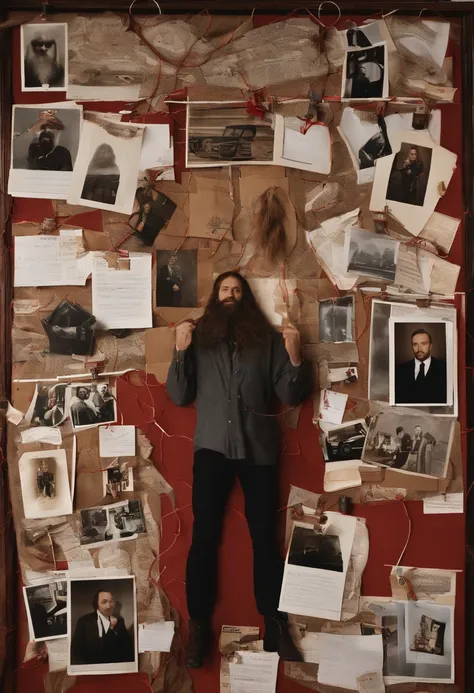
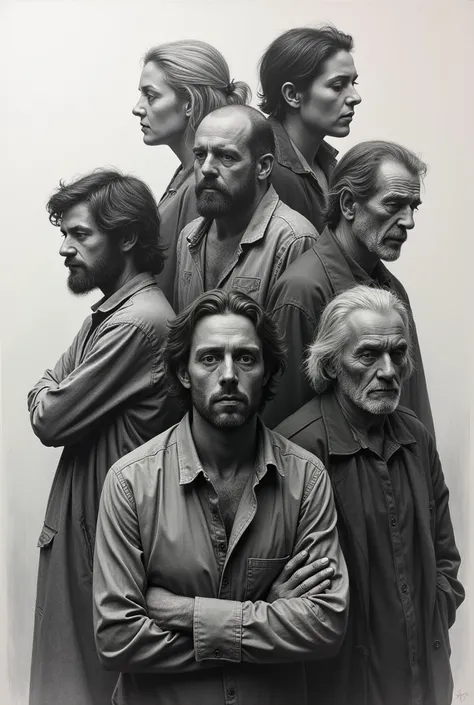
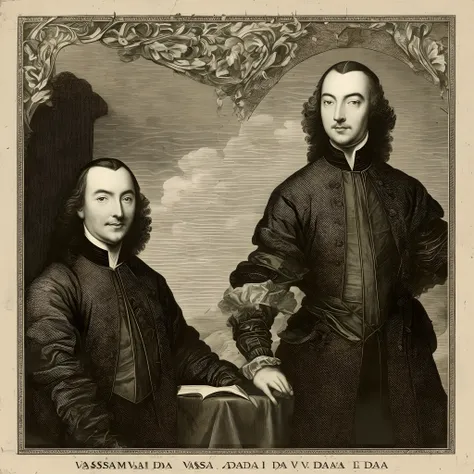
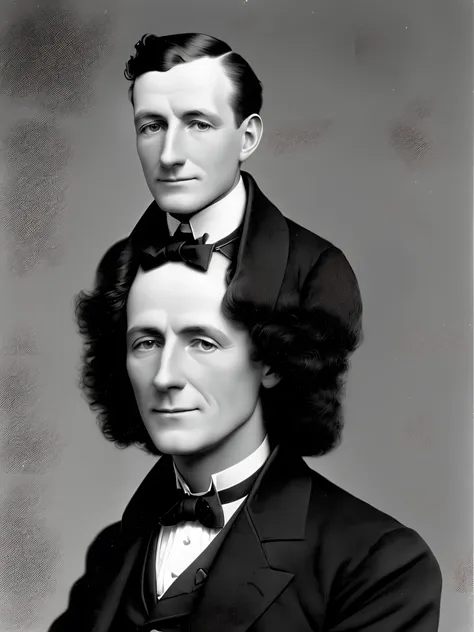
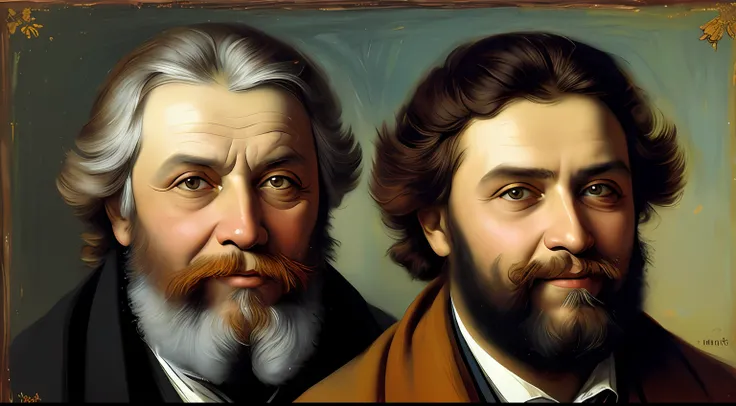
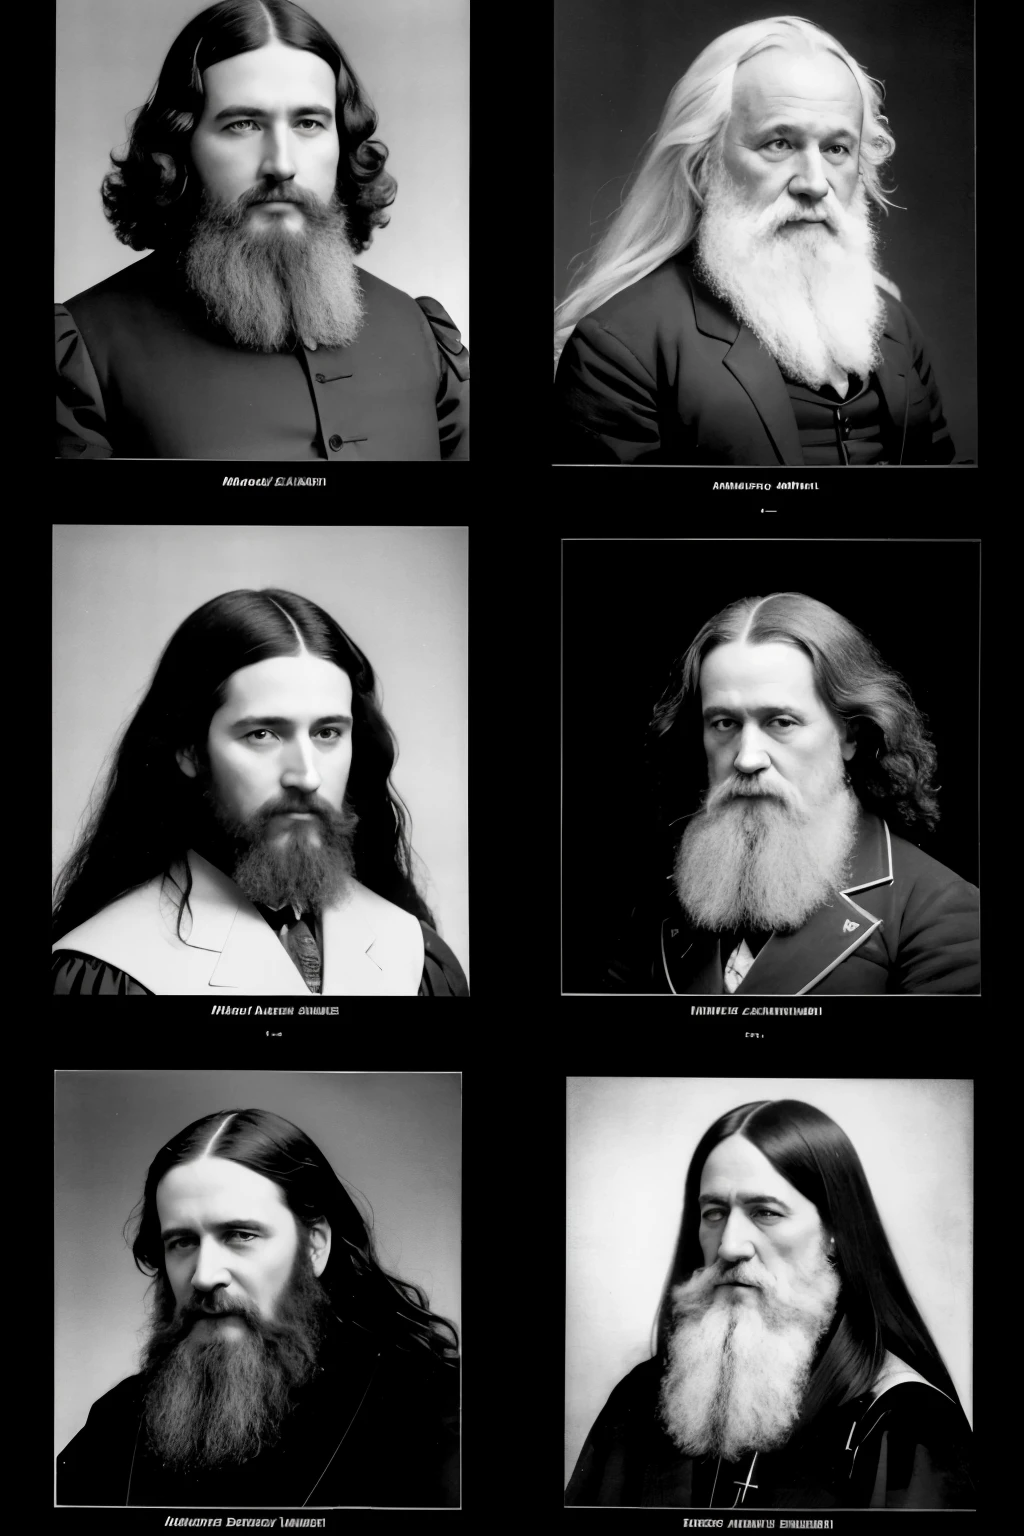
A series of black and white photos of a man with long beards


import matplotlib.pyplot as plt import matplotlib.patches as patches # Create a figure and axis fig, ax = plt.subplots(figsize=(10, 10)) # Define the positions and labels for the scientists scientists = { "Albert Einstein": (0.2, 0.8), "Isaac Newton": (0.2, 0.6), "Marie Curie": (0.2, 0.4), "Dmitri Mendeleev": (0.2, 0.2), "Charles Darwin": (0.8, 0.8), "Gregor Mendel": (0.8, 0.6), "Ada Lovelace": (0.8, 0.4), "Pitagoras": (0.8, 0.2) } # Add rectangles and labels to the plot for name, (x, y) in scientists.items(): ax.add_patch(patches.Rectangle((x - 0.1, y - 0.05), 0.2, 0.1, edgecolor='black', facecolor='lightgray')) ax.text(x, y, name, ha='center', va='center', fontsize=10) # Set the axis limits and remove the axes ax.set_xlim(0, 1) ax.set_ylim(0, 1) ax.axis('off') # Add the title plt.title("Vida e Obra de Grandes Cientistas", fontsize=14) # Display the plot plt.show()
프롬프트
Copy prompts
import matplotlib
.
pyplot as plt
import matplotlib
.
patches as patches
# Create a figure and axis
fig
,
ax = plt
.
subplots(figsize=(10
,
10))
# Define the positions and labels for the scientists
scientists = {
"Albert Einstein": (0
.
2
,
0
.
8)
,
"Isaac Newton": (0
.
2
,
0
.
6)
,
"Marie Curie": (0
.
2
,
0
.
4)
,
"Dmitri Mendeleev": (0
.
2
,
0
.
2)
,
"Charles Darwin": (0
.
8
,
0
.
8)
,
"Gregor Mendel": (0
.
8
,
0
.
6)
,
"Ada Lovelace": (0
.
8
,
0
.
4)
,
"Pitagoras": (0
.
8
,
0
.
2)
}
# Add rectangles and labels to the plot
for name
,
(x
,
y) in scientists
.
items():
ax
.
add_patch(patches
.
Rectangle((x - 0
.
1
,
y - 0
.
05)
,
0
.
2
,
0
.
1
,
edgecolor='black'
,
facecolor='lightgray'))
ax
.
text(x
,
y
,
name
,
ha='center'
,
va='center'
,
fontsize=10)
# Set the axis limits and remove the axes
ax
.
set_xlim(0
,
1)
ax
.
set_ylim(0
,
1)
ax
.
axis('off')
# Add the title
plt
.
title("Vida e Obra de Grandes Cientistas"
,
fontsize=14)
# Display the plot
plt
.
show()
정보
Checkpoint & LoRA

Checkpoint
Realisian
#사실적인
#사진
0개의 댓글
0
0
0