To create a visual map of the customer journey based on the information provided
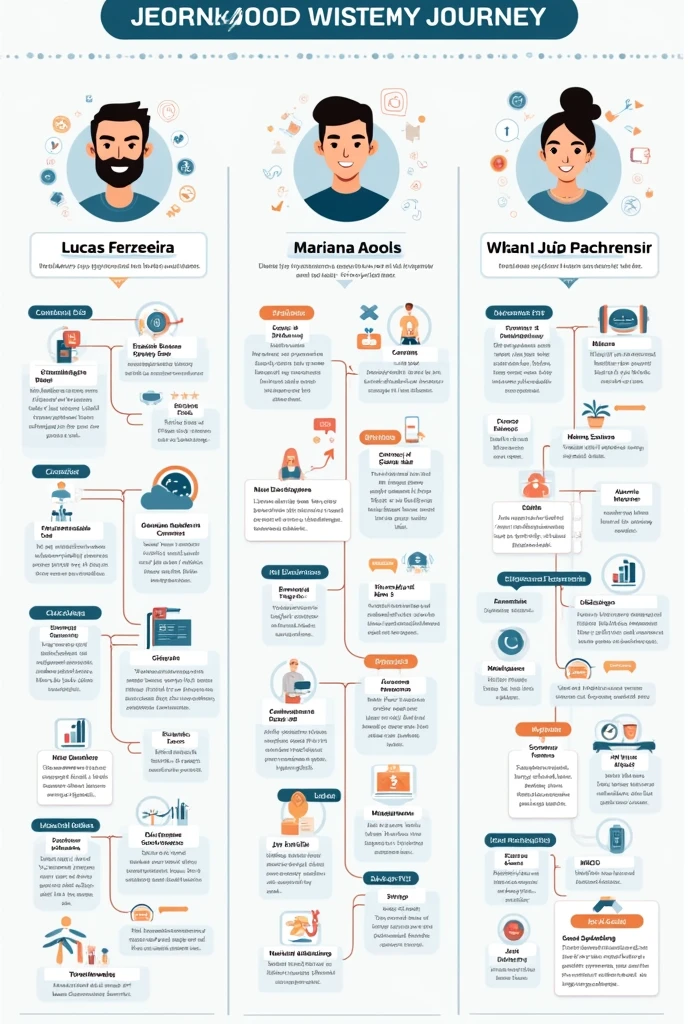


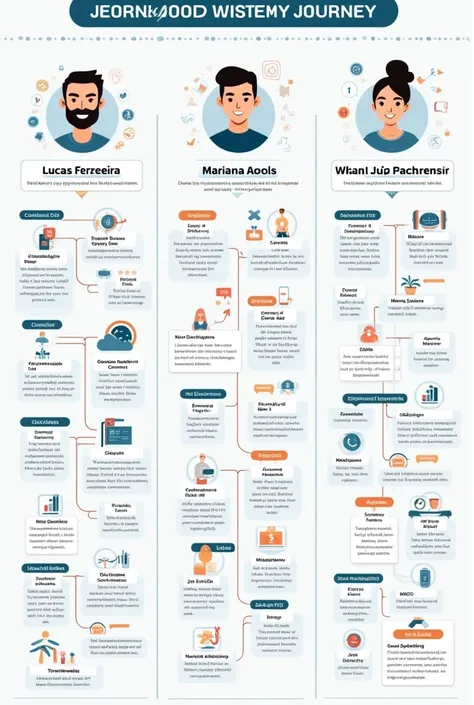
to create a visual map of the customer journey based on the information provided to Lucas Ferreira, Mariana Santos and João Oliveira, You can follow a template that illustrates each stage of the consumer journey and how it unfolds for each persona. Here is an example of how you can structure and visualize the map: Visual Map of the Consumer Journey 1. Lucas Ferreira Discovery: fountain: Instagram Ad Content: Highlight the gamification of training Consideration: questions: The app is really fun? The challenges are suitable for my level? Action: Review Search and Demo Video Viewing Decision: Action: Decide to try the app after positive reviews and video Experience: feelings: Gosta dos desafios e da sensação de progressão Action: Keep training with the Post-Purchase app: Action: Share on social media and recommend to friends 2. Mariana Santos Discovery: fountain: Research in Facebook groups of physical education teachers Contents: Seeking new teaching tools Consideration: questions: The app can be integrated into classes? Students will get involved? Action: Try the app for free Decision: Action: Purchase the premium version after seeing the students' excitement Experience: feelings: Alunos mais engajados e motivados Action: Improves the dynamics of post-purchase classes: Action: Publishes blog article and shares at conferences 3. João Oliveira Discovery: fountain: Recommendation from a colleague on LinkedIn Content: Wellness Apps Consideration: questions: The app fits my schedule? Offers quick workouts? Action: Decide to test the Decision app: Action: Test the application attracted by the combination of challenges and efficiency Experience: feelings: Surpreendido com a facilidade de encaixar os treinos Action: Include the app in your daily routine Post-purchase: Action: Recommend the app in professional groups Map View To create an effective visualization, you can use a graphic design tool or
提示詞
復製
to create a visual map of the customer journey based on the information provided to Lucas Ferreira
,
Mariana Santos and João Oliveira
,
You can follow a template that illustrates each stage of the consumer journey and how it unfolds for each persona
.
Here is an example of how you can structure and visualize the map:
Visual Map of the Consumer Journey 1
.
Lucas Ferreira Discovery:
fountain: Instagram Ad Content: Highlight the gamification of training Consideration:
questions: The app is really fun
?
The challenges are suitable for my level
?
Action: Review Search and Demo Video Viewing Decision:
Action: Decide to try the app after positive reviews and video Experience:
feelings: Gosta dos desafios e da sensação de progressão
Action: Keep training with the Post-Purchase app:
Action: Share on social media and recommend to friends 2
.
Mariana Santos Discovery:
fountain: Research in Facebook groups of physical education teachers Contents: Seeking new teaching tools Consideration:
questions: The app can be integrated into classes
?
Students will get involved
?
Action: Try the app for free Decision:
Action: Purchase the premium version after seeing the students'
;
excitement Experience:
feelings: Alunos mais engajados e motivados
Action: Improves the dynamics of post-purchase classes:
Action: Publishes blog article and shares at conferences 3
.
João Oliveira Discovery:
fountain: Recommendation from a colleague on LinkedIn Content: Wellness Apps Consideration:
questions: The app fits my schedule
?
Offers quick workouts
?
Action: Decide to test the Decision app:
Action: Test the application attracted by the combination of challenges and efficiency Experience:
feelings: Surpreendido com a facilidade de encaixar os treinos
Action: Include the app in your daily routine Post-purchase:
Action: Recommend the app in professional groups Map View To create an effective visualization
,
you can use a graphic design tool or
信息
模型 & 風格

模型
SeaArt Infinity
#卡通
#產品設計
#SeaArt Infinity
共 0 條評論
1
0
0