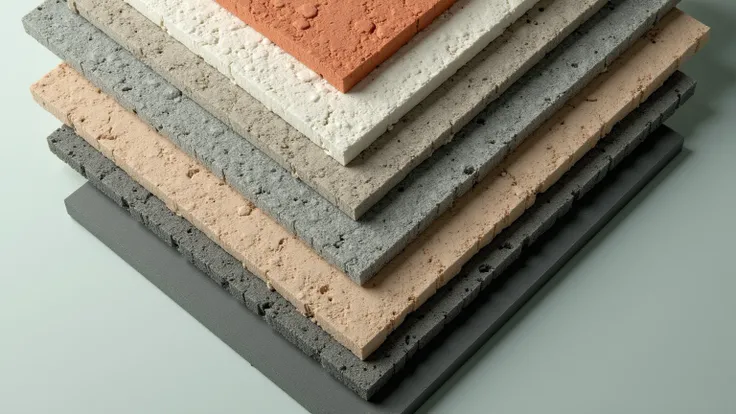
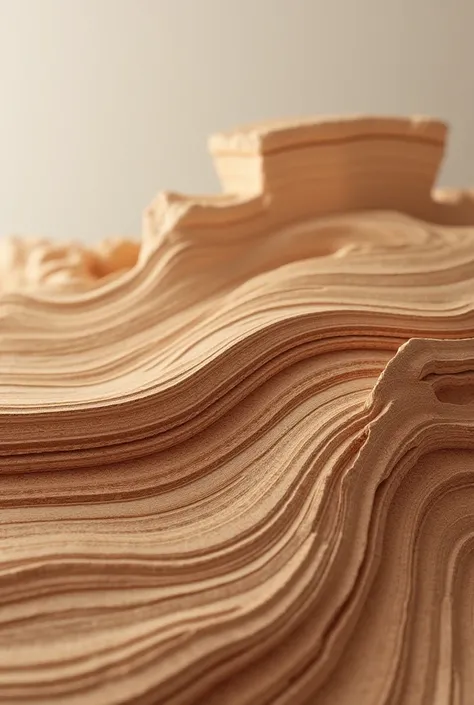
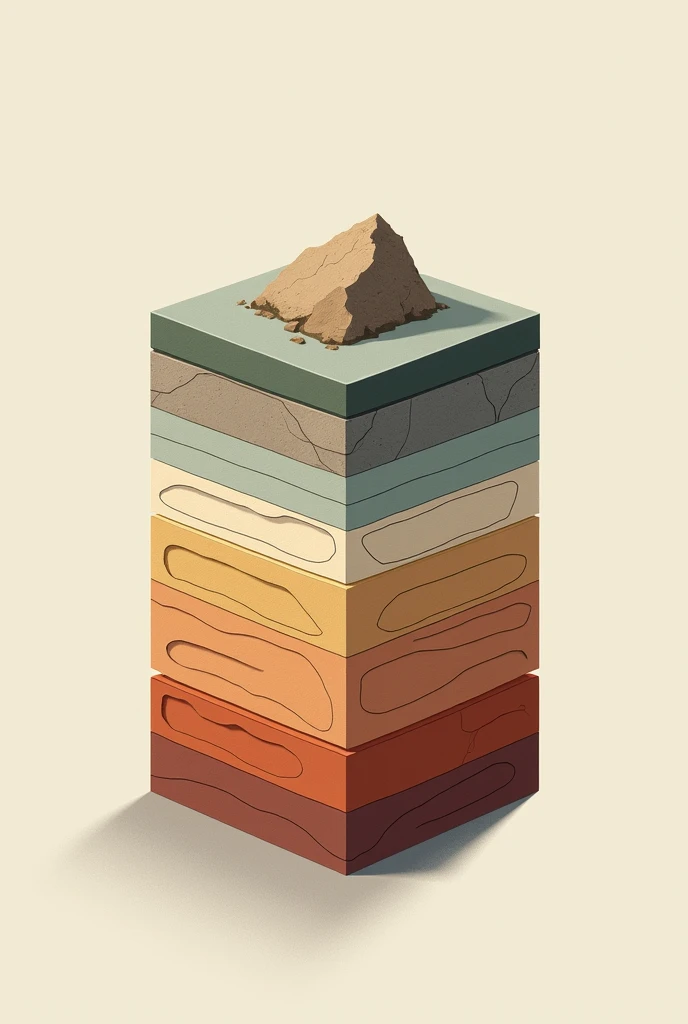
A close up of a stack of different colored paper pieces
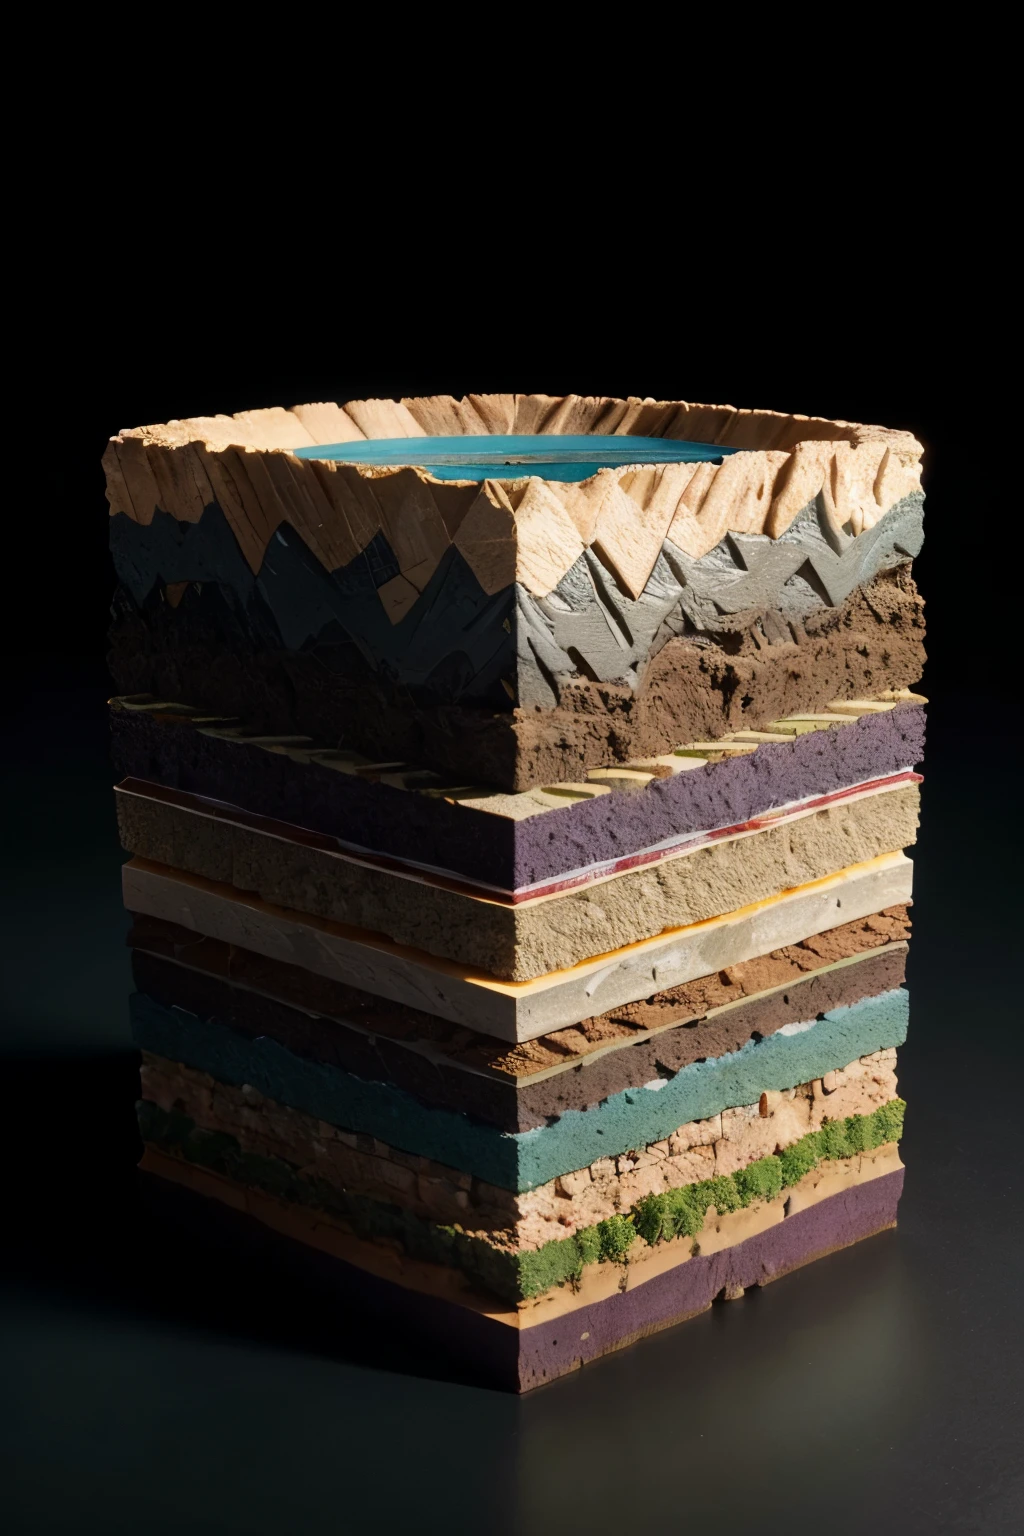


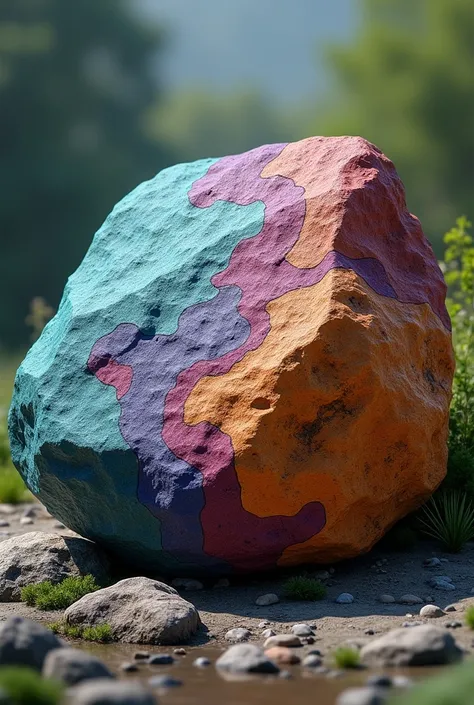
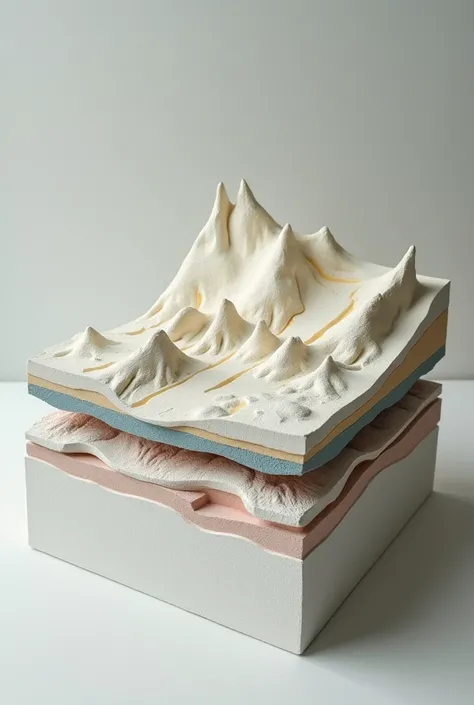
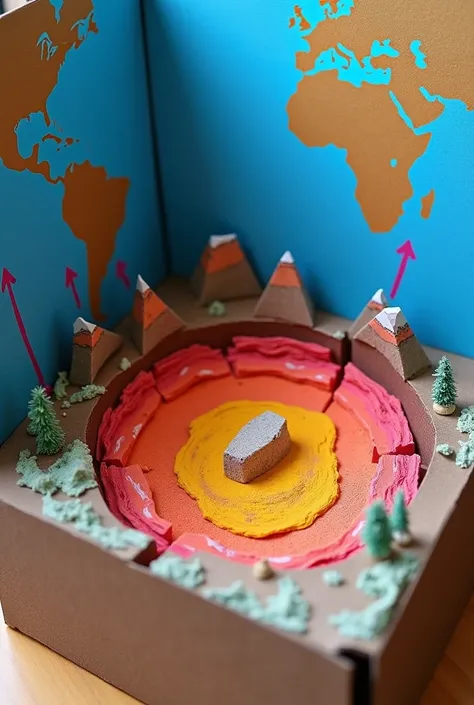
The picture shows a 3D geological model with multiple stratified layers. Here is a detailed description: 1. **Layers**: - The model consists of several colored horizontal layers, each representing different geological strata. - The topmost layer is blue, followed by other layers in shades of orange, green, and purple. - The layers appear to be stacked one on top of another, with a wavy interface indicating variations in depth and structure. 2. **Axes**: - The **X-axis** runs along the bottom front edge of the model, marked with numbers from 450 to 520, indicating horizontal distance. - The **Y-axis** runs vertically along the left edge, marked with numbers from 7920 to 7960, indicating vertical distance or depth. - The **Z-axis** is along the bottom right side, though less prominently labeled, it suggests another horizontal distance or extent. 3. **Contour and Depth Variations**: - The layers are not flat; they exhibit undulations and contours, indicating variations in geological formations. - There is a notable dip or depression in the lower purple layer, suggesting a significant geological feature such as a fault or basin. 4. **3D Perspective**: - The model is presented in a 3D perspective, allowing viewers to see the spatial relationships and depth of each layer. - The perspective gives a sense of depth, with the top layers more prominently visible and the lower layers receding into the background. This type of 3D geological model is typically used to visualize subsurface geological formations, which is crucial for activities like mining, oil exploration, and geological surveys. create this image
プロンプト
プロンプトをコピー
The picture shows a 3D geological model with multiple stratified layers
.
Here is a detailed description:
1
.
**Layers**:
- The model consists of several colored horizontal layers
,
each representing different geological strata
.
- The topmost layer is blue
,
followed by other layers in shades of orange
,
green
,
and purple
.
- The layers appear to be stacked one on top of another
,
with a wavy interface indicating variations in depth and structure
.
2
.
**Axes**:
- The **X-axis** runs along the bottom front edge of the model
,
marked with numbers from 450 to 520
,
indicating horizontal distance
.
- The **Y-axis** runs vertically along the left edge
,
marked with numbers from 7920 to 7960
,
indicating vertical distance or depth
.
- The **Z-axis** is along the bottom right side
,
though less prominently labeled
,
it suggests another horizontal distance or extent
.
3
.
**Contour and Depth Variations**:
- The layers are not flat
;
they exhibit undulations and contours
,
indicating variations in geological formations
.
- There is a notable dip or depression in the lower purple layer
,
suggesting a significant geological feature such as a fault or basin
.
4
.
**3D Perspective**:
- The model is presented in a 3D perspective
,
allowing viewers to see the spatial relationships and depth of each layer
.
- The perspective gives a sense of depth
,
with the top layers more prominently visible and the lower layers receding into the background
.
This type of 3D geological model is typically used to visualize subsurface geological formations
,
which is crucial for activities like mining
,
oil exploration
,
and geological surveys
.
create this image
情報
Checkpoint & LoRA

Checkpoint
epiCRealism
コメント:0件
0
0
0