Illustrate a three-dimensional graph showing the relationship between the solubi
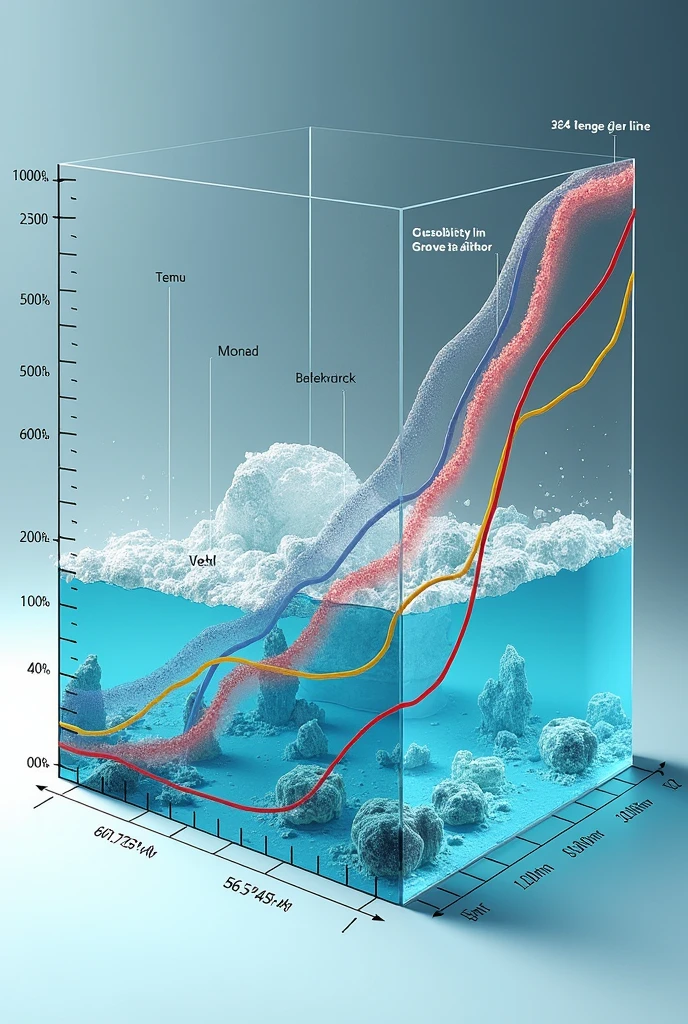


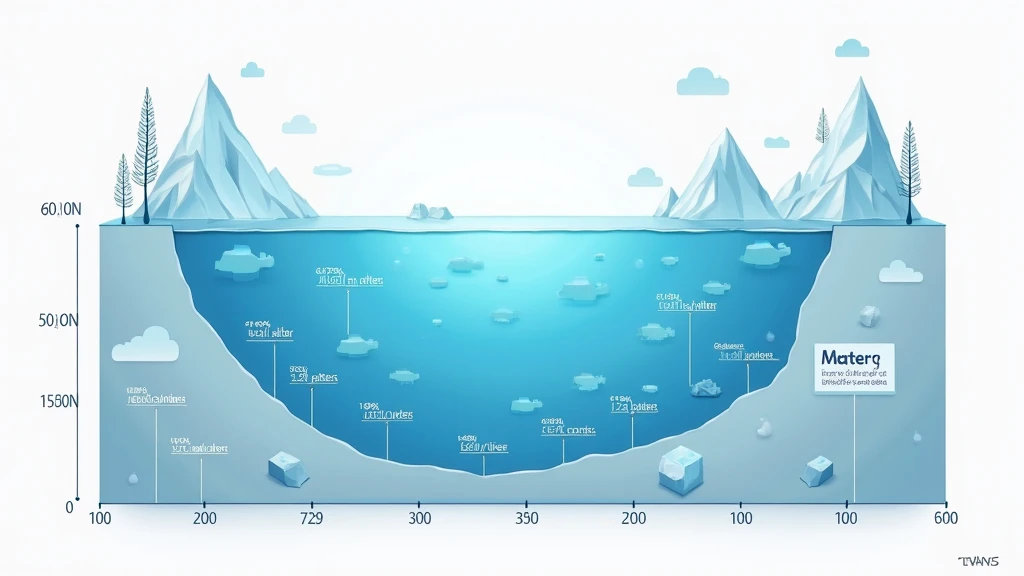
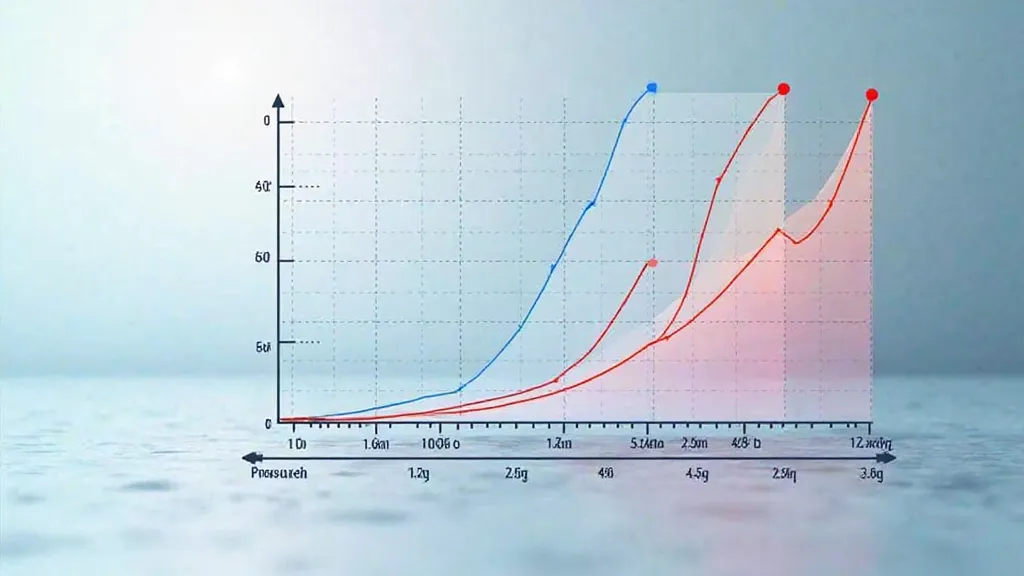
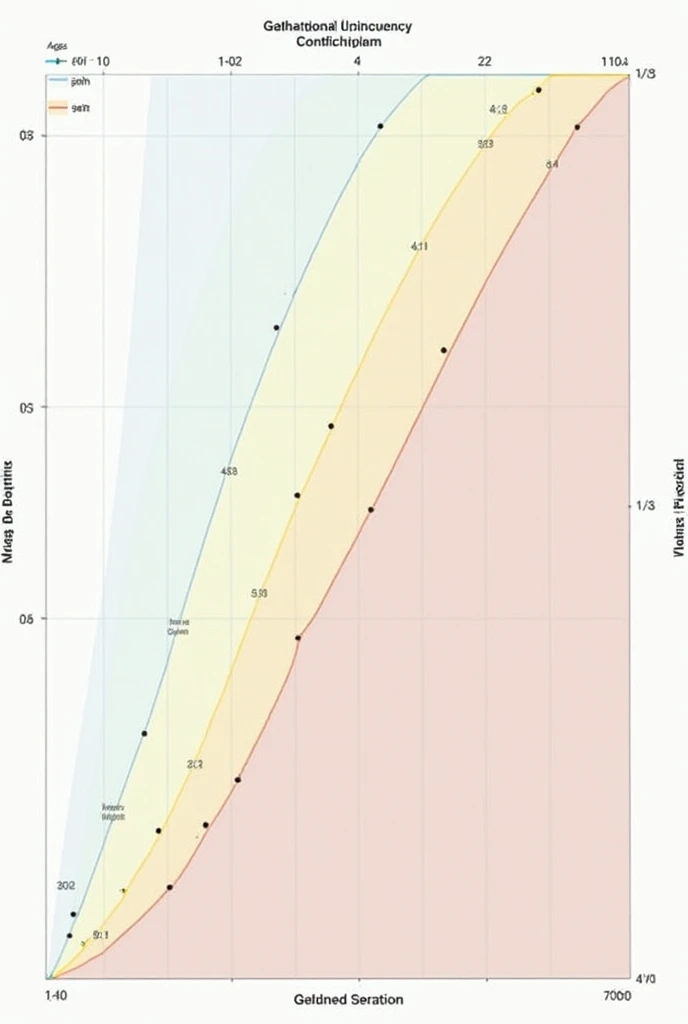
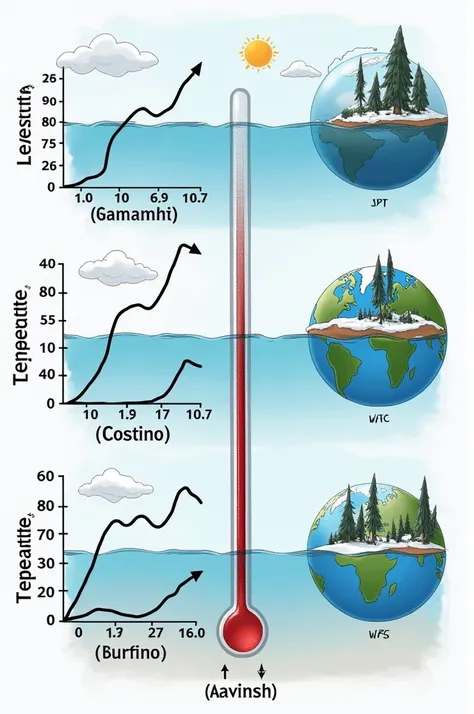
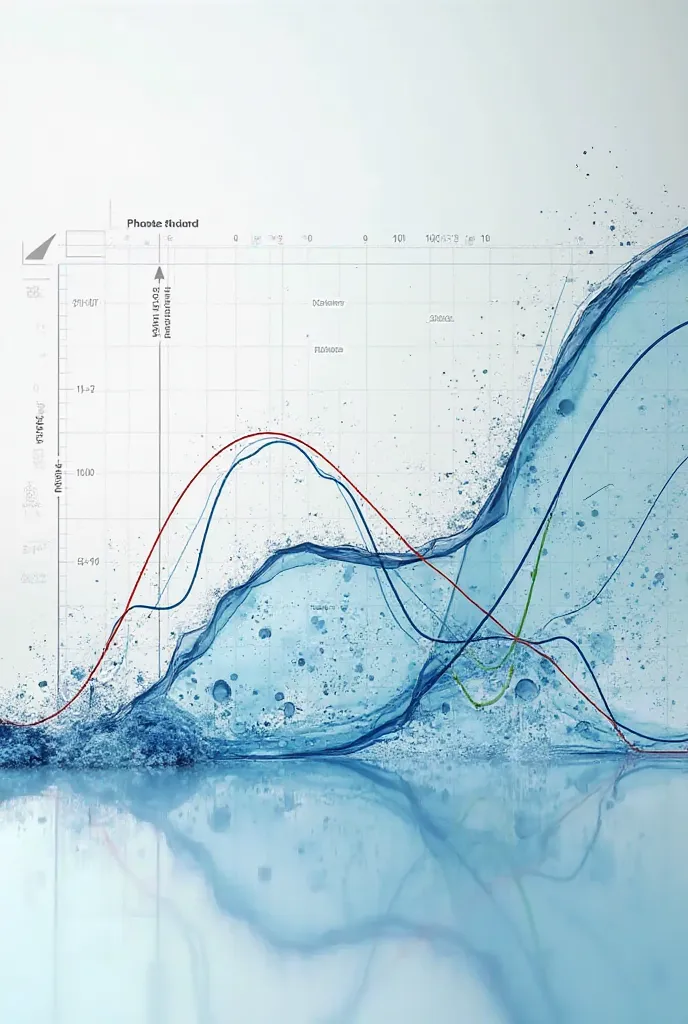
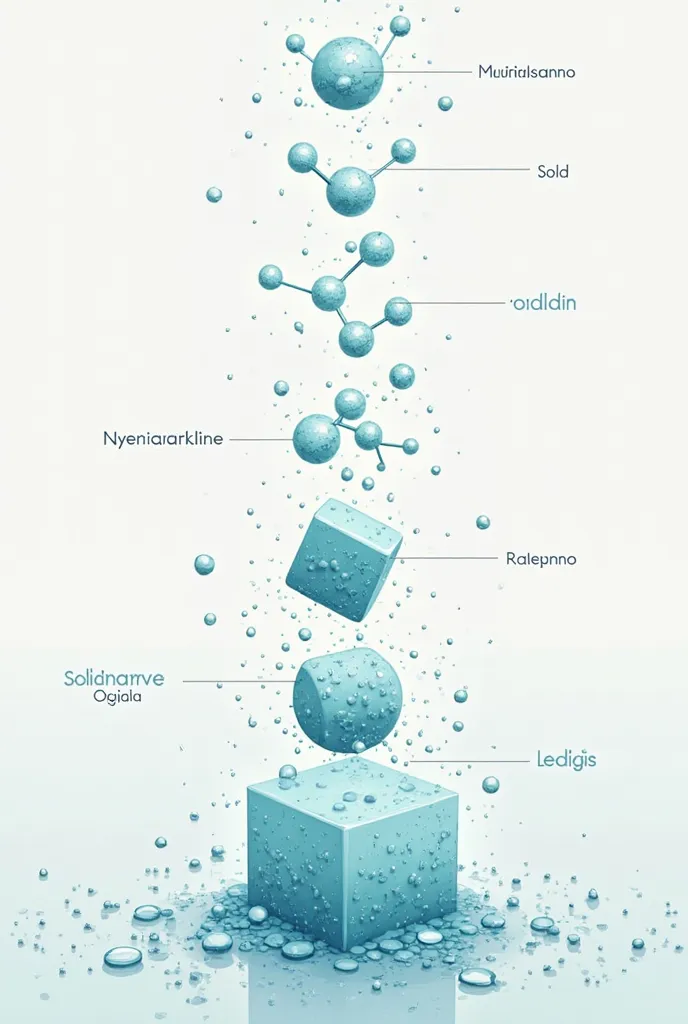
Illustrate a three-dimensional graph showing the relationship between the solubility of a substance (in grams per liter) and the temperature (in degrees Celsius). The horizontal axis represents the temperature, the vertical axis the solubility, and the depth axis can display different substances or types of solvents. Uses an ascending curve to reflect how solubility increases with temperature in most cases. Add different lines or colors for each substance represented, with clear labels to indicate their name and specific characteristics. In the background, includes a visual representation of a crystal dissolving in a liquid to provide visual context about the dissolution process
S
Prompts
Copiar prompts
Illustrate a three-dimensional graph showing the relationship between the solubility of a substance (in grams per liter) and the temperature (in degrees Celsius)
.
The horizontal axis represents the temperature
,
the vertical axis the solubility
,
and the depth axis can display different substances or types of solvents
.
Uses an ascending curve to reflect how solubility increases with temperature in most cases
.
Add different lines or colors for each substance represented
,
with clear labels to indicate their name and specific characteristics
.
In the background
,
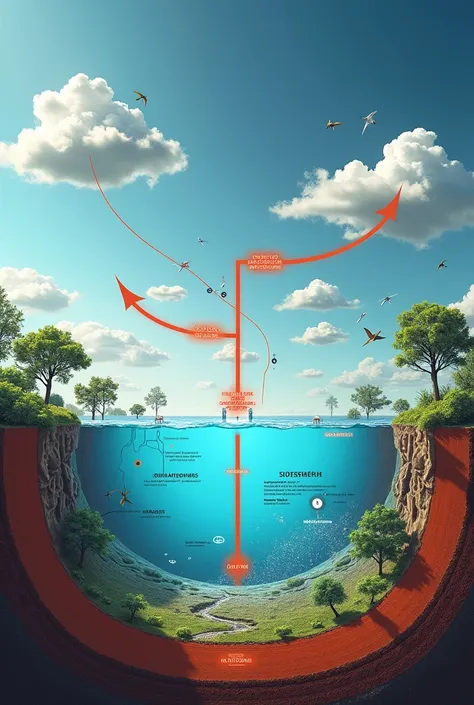
includes a visual representation of a crystal dissolving in a liquid to provide visual context about the dissolution process
INFO
Checkpoint & LoRA
Checkpoint
SeaArt Infinity
#Paisagem
#SeaArt Infinity
comentário(s)
0
0
0
Apps de IA Rápida de SeaArt

Troca de Rosto com IA
Explore diferentes identidades e descubra seu novo eu com um clique.

AI Melhorador de Imagens
Experimente um banquete visual em HD agora!

Remover fundo.
IA inteligente para remover o fundo.
Ferramenta de geração de imagens AI a partir de texto
Transforme textos simples em obras de arte impressionantes.
Borrador de IA
Apagar defeitos da imagem ou objetos indesejados mantendo o fundo intacto
Criar imagem a partir do rascunho.
Crie belas obras com apenas alguns traços simples.
Explore mais aplicativos AI