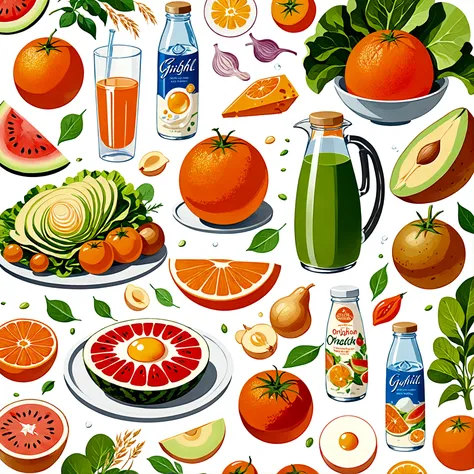
Mosaic of graphs and charts: Create a mosaic-style design using Tableau
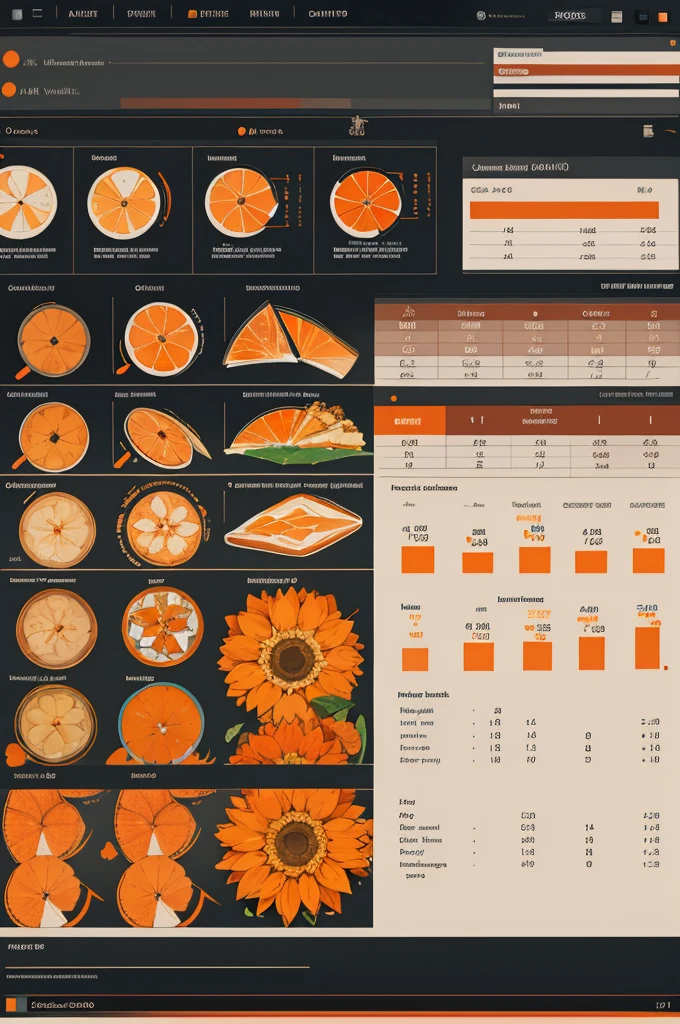


Mosaic of graphs and charts: Create a mosaic-style design using Tableau's brand colors, orange and white. Combine various data visualizations such as bar graphs, line charts, and pie charts to represent the diversity of data analysis.
Prompts
Copier les Paramètres
Mosaic of graphs and charts: Create a mosaic-style design using Tableau's brand colors
,
orange and white
.
Combine various data visualizations such as bar graphs
,
line charts
,
and pie charts to represent the diversity of data analysis
.
Info
Checkpoint & LoRA

Checkpoint
GrandMix
#Conception de produit
0 commentaire(s)
0
0
0
Apps AI Rapides de SeaArt

Échange de Visage AI
Explorez différentes identités et découvrez vous-même à nouveau en un clic

Agrandisseur d'Image AI
Faites aujourd'hui la magie d'une clarté cristalline !

Suppression de l'arrière-plan
Supprimer l'arrière-plan par AI

Générateur de Txt2Img AI
Transformez des Mots Simples en Art Saisissant

Portrait AI
Réalisez votre portrait en un clic et débloquez votre style unique !

Suppression AI
Supprimez les imperfections ou les objets indésirables des images tout en préservant l'arrière-plan intact
Explorez Nos Outils AI Rapides