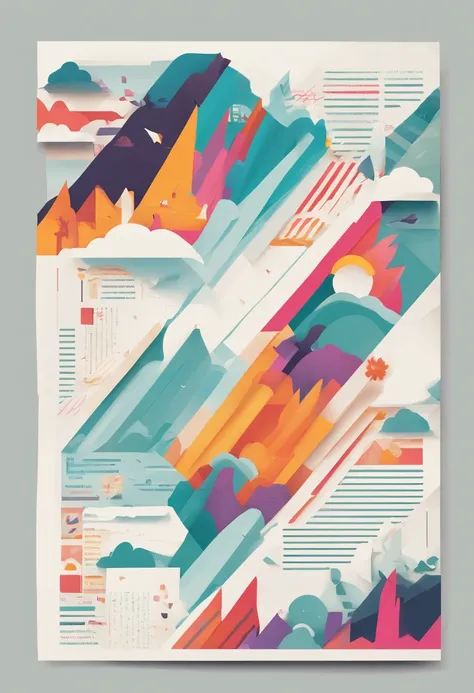
A poster with a colorful graphic of a road and clouds


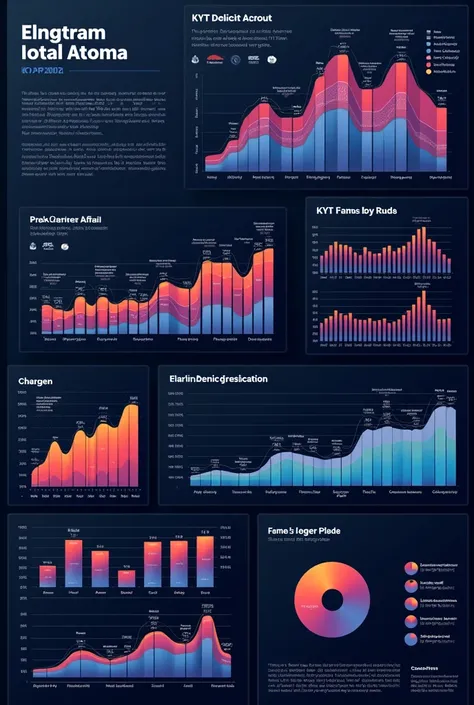
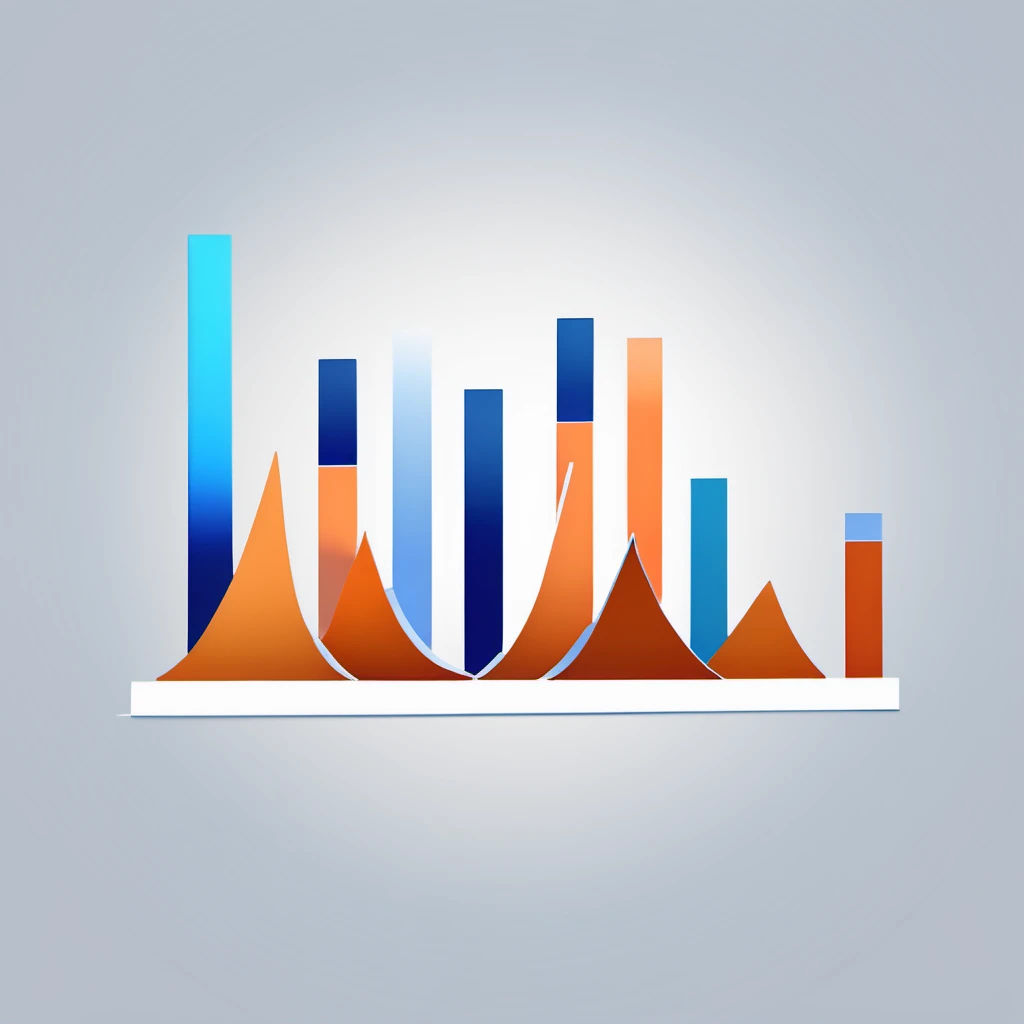
Imagine an image that captures the essence of this powerful trading tool. Visualize a dynamic and modern financial chart, preenchido com cores vibrantes que fluem suavemente umas para as outras. The scene begins with a base of deep tones that represent the baseline of prices. As you follow the upward curve of the chart, esses tons gradualmente se transformam em cores mais intensas, symbolizing the intensification of upward trends. At the point where the trend begins to reverse, as cores se fundem de maneira sutil e elegante, creating a transition zone that is both visually stunning and informative. Imagine that the chart is interspersed with strategic markers that indicate moments of reversal and trend confirmation. These markers can be represented by unique visual elements, as elegant arrows and symbols that reflect the action of the market. A imagem culmina com um destaque impressionante: a side chart that demonstrates the evolution of the ProGradient™️ Linear Gradient in action. In this chart, Complex price data is distilled into an elegant, easy-to-read form, clearly displaying changes in trends and reversals convincingly. Each element of the image conveys the feeling of innovation, Confidence and market dominance. Dynamic colors and intuitive visualization combine to create a visual representation of the power of Linear Gradient. All of this is a manifestation of the future of trading, as traders rise to a new level of technical analysis. Create that vivid image in your mind and experience the ProGradient revolution
Подсказки
Копировать подсказки
Imagine an image that captures the essence of this powerful trading tool
.
Visualize a dynamic and modern financial chart
,
preenchido com cores vibrantes que fluem suavemente umas para as outras
.
The scene begins with a base of deep tones that represent the baseline of prices
.
As you follow the upward curve of the chart
,
esses tons gradualmente se transformam em cores mais intensas
,
symbolizing the intensification of upward trends
.
At the point where the trend begins to reverse
,
as cores se fundem de maneira sutil e elegante
,
creating a transition zone that is both visually stunning and informative
.
Imagine that the chart is interspersed with strategic markers that indicate moments of reversal and trend confirmation
.
These markers can be represented by unique visual elements
,
as elegant arrows and symbols that reflect the action of the market
.
A imagem culmina com um destaque impressionante: a side chart that demonstrates the evolution of the ProGradient™️ Linear Gradient in action
.
In this chart
,
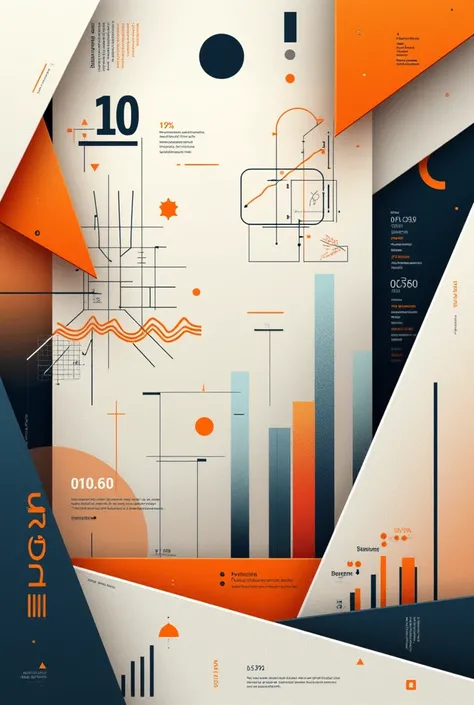
Complex price data is distilled into an elegant
,
easy-to-read form
,
clearly displaying changes in trends and reversals convincingly
.
Each element of the image conveys the feeling of innovation
,
Confidence and market dominance
.
Dynamic colors and intuitive visualization combine to create a visual representation of the power of Linear Gradient
.
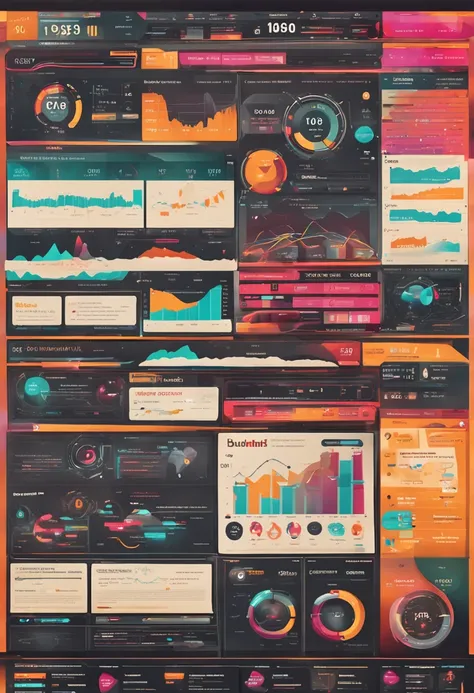
All of this is a manifestation of the future of trading
,
as traders rise to a new level of technical analysis
.
Create that vivid image in your mind and experience the ProGradient revolution
Информация
0 комментариев
0
0
0
SeaArt: Удобные AI Apps

Замена лица с помощью ИИ
Исследуйте разные идентичности и откройте для себя свою новую личность одним кликом.

AI улучшитель изображений
Испытайте визуальное наслаждение в HD прямо сейчас!

Убрать фон.
AI-интеллектуальное распознавание и удаление фона.

Инструмент создания изображений AI из текста
Преобразуйте простой текст в удивительные произведения искусства.

AI портрет
Одним кликом достигается свобода фотографии, разблокируя мои различные стили

AI-стиратель
Удалить дефекты изображения или нежелательные объекты, сохраняя фон
Исследуйте наши быстрые инструменты AI