There is a picture of a water fountain with a red flag
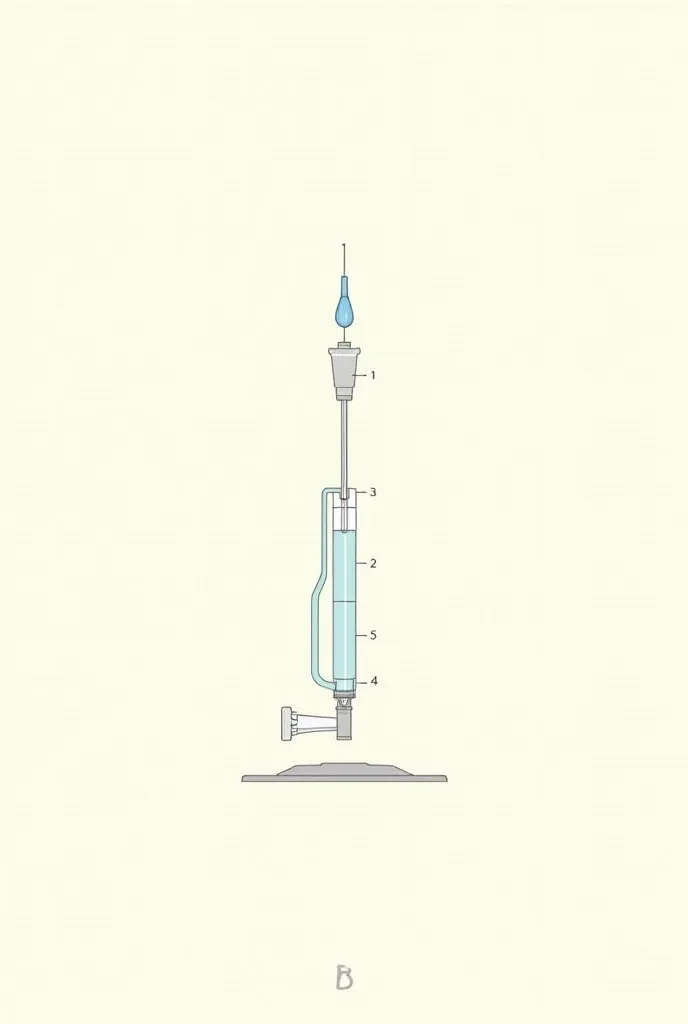
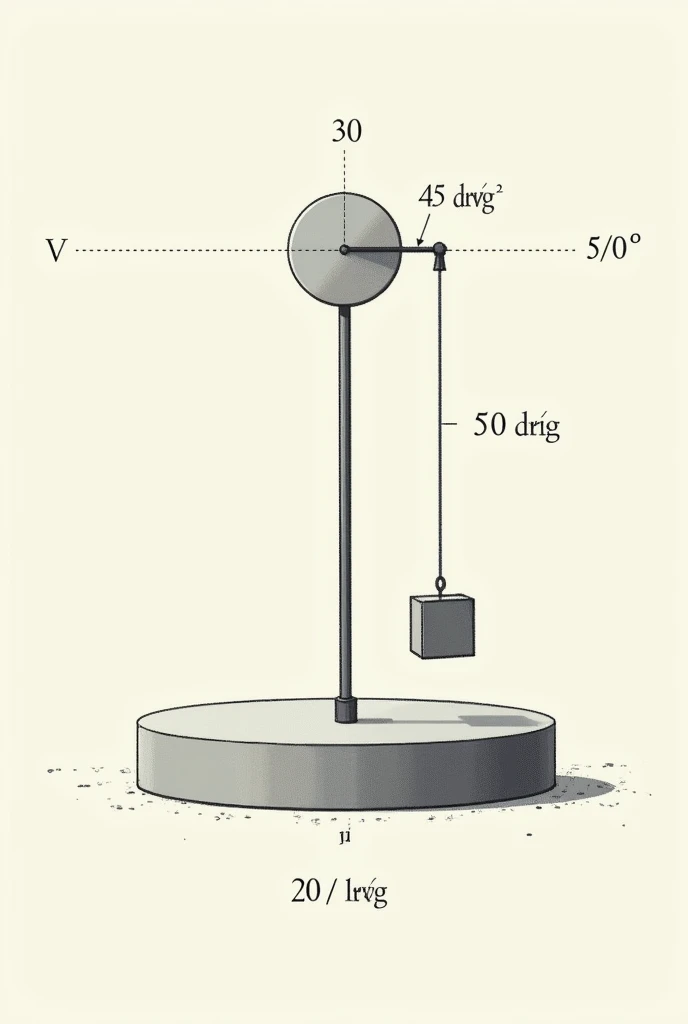
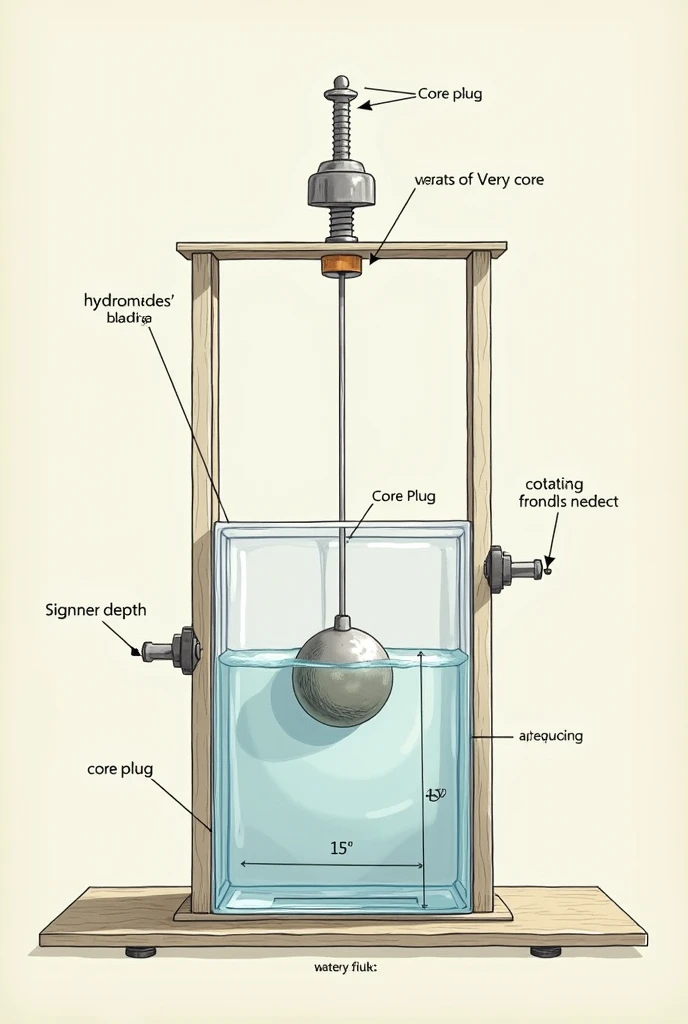
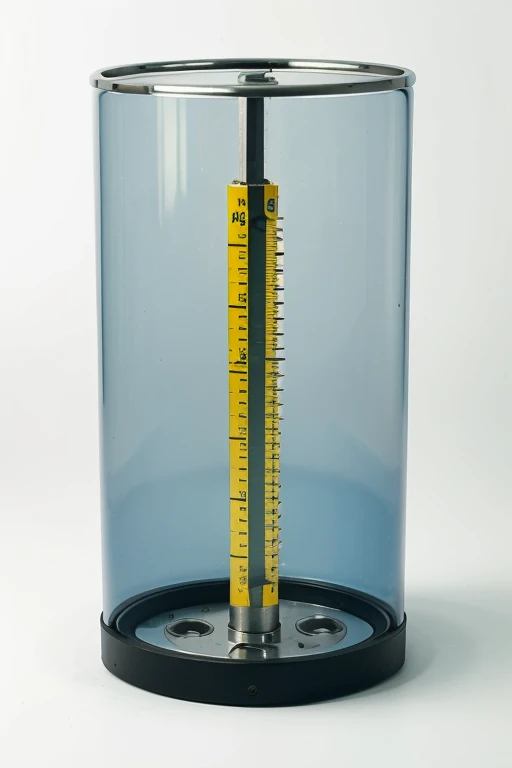
An energy conversion apparatus, as illustrated on the right, consists of a vessel filled with water. Falling masses, with a total mass of 11.5 kg, are allowed to descend 1.3 m, propelling paddles in the water. The mechanical energy from the falling masses is entirely converted into internal energy in the water. The agitation from the paddles increases the water's internal energy, and the temperature change of the water is measured to quantify this increase. Graph Components: Distance (x-axis): Represent the distance through which the masses fall on the x-axis. Energy (y-axis): Use the y-axis to depict energy levels. Consider using Joules as the unit. Key Elements to Include: Initial Mechanical Energy: Plot the initial potential energy of the falling masses. Final Mechanical Energy: Show the decrease in potential energy as the masses fall. Internal Energy of Water: Illustrate the internal energy gained by the water due to the mechanical energy conversion. Temperature Change Indicator: Place a marker or line to represent the measured temperature change of the water. Graphical Format: Use lines or bars to connect the points and show the transformation of mechanical energy into internal energy. Distinguish between different energy levels visually. Annotations: Label each key point on the graph, and provide annotations to explain the significance of changes in energy levels. Indicate how the temperature change is correlated with the internal energy increase. Note: Consider the conservation of energy principle and ensure that the total energy at any point in the graph remains constant. Emphasize that no energy is transferred as heat to or from the surroundings.
Подсказки
Копировать подсказки
An energy conversion apparatus
,
as illustrated on the right
,
consists of a vessel filled with water
.
Falling masses
,
with a total mass of 11
.
5 kg
,
are allowed to descend 1
.
3 m
,
propelling paddles in the water
.
The mechanical energy from the falling masses is entirely converted into internal energy in the water
.
The agitation from the paddles increases the water's internal energy
,
and the temperature change of the water is measured to quantify this increase
.
Graph Components:
Distance (x-axis): Represent the distance through which the masses fall on the x-axis
.
Energy (y-axis): Use the y-axis to depict energy levels
.
Consider using Joules as the unit
.
Key Elements to Include:
Initial Mechanical Energy: Plot the initial potential energy of the falling masses
.
Final Mechanical Energy: Show the decrease in potential energy as the masses fall
.
Internal Energy of Water: Illustrate the internal energy gained by the water due to the mechanical energy conversion
.
Temperature Change Indicator: Place a marker or line to represent the measured temperature change of the water
.
Graphical Format:
Use lines or bars to connect the points and show the transformation of mechanical energy into internal energy
.
Distinguish between different energy levels visually
.
Annotations:
Label each key point on the graph
,
and provide annotations to explain the significance of changes in energy levels
.
Indicate how the temperature change is correlated with the internal energy increase
.
Note:
Consider the conservation of energy principle and ensure that the total energy at any point in the graph remains constant
.
Emphasize that no energy is transferred as heat to or from the surroundings
.
Информация
Checkpoint & LoRA

Checkpoint
epiCRealism
#Дизайн продукта
0 комментариев
0
0
0


